INTRODUCTION
TRIGO PAN
Triticum aestivum L.
Wheat harvest 2010/11 is considered to be concluded on a harvested area of 4,27 million hectares. Average national yield was 3,40 ton/ha (historic record) versus 2,51 ton/ha in the previous campaign, resulting in a national estimated production of 14,5 million tons (MT), 97% higher than the previous campaign. The reason for such good harvest was attributed to excellent yields due to very good environmental conditions and the harvested area which increased in a 67% regarding the previous cycle.
| |||||||||||||||||||||||||||||||||||||||||||||||||||||||||||||||||||||||||||||||||||||||
Buenos Aires province contributed most to the national production with 8,7 MT, followed by Cordoba with 1,8 MT, Santa Fe 1,7 MT, Entre Rios 1,1 MT and the rest of the country with 1,3 MT.
In sub region IV, due to good climate conditions, yields were between 4.000 and 7.000 kg/ha, with some problems in commercial quality since grain protein was lower than normal.
In the region II South yields exceeded all historic records for this crop, with some lots over 8.000 kg/ha, with test weights in some cases of 85 kg/hl and weight of 1000 grains in many cases reached 40 gr.
South V region showed great variability with yields of 1.000 kg/ha to 3.300 kg/ha, the last ones in hill zones of deep soils.
In II North, average yields were placed between 4.000 and 5.500 kg/ha with peaks of 8.000 kg/ha.
In region III yields were excellent, with an average of 3.844 kg/ha, historic record for the province of Entre Rios.
In region I the yields obtained oscillated from 1.500 to 5.000 kg/ha with average per department that varied from 3.000 to 3.500 kg/ha, standing out several plots with maximum productivity which were placed between 4.000 and 5.000 kg/ha.
In NOA region the average yield was 1.420 kg/ha, duplicating the yield of the previous campaign which was of 650 kg/ha, while in NEA region the average yield exceeded 2.500 kg/ha.
In these unprecedented results there was an incidence of a good distribution of rainfalls and excellent climate conditions during grain filling. Cool temperatures during October, together with good radiation conditions, facilitated the formation of grains and a normal grain filling.As it is normal in years of high yields, protein decreases as well as the quantity of gluten.
SAMPLING STRUCTURE
It was agreed to obtain samples which represent about 4,000 tons each, reaching a total of 242 analyses to be performed.
The sampling was planned proportionally to the territorial division (district or department) sown area, and the average yield registered the last three years, according to the Secretariat of Agriculture, Livestock, Fishery and Food data. In accordance with the estimated production resulting, the composite sample number to be obtained by each district or department was determined to achieve a proportional representativeness of each locality.
The Argentine Cooperatives Association, the Federation of Country Elevators Association, Argentine Federated Farmers SCL and the Argentine Federation of Milling Industry, through the cooperatives, country elevators and mills selected for each locality, submitted the primary operations samples (trade samples of farmer deliveries) which were starting points to make the locality composite samples, according to instructions given to those in charge of the sampling.
Likewise the National Directorate for Processing and Marketing of Agricultural and Forestry Products. Ministry of Agriculture, Livestock and Fisheries of Argentina bring the support in the sampling
| ||||||||||||||||||||||||||||||||||||||||||||||||||||||||||||
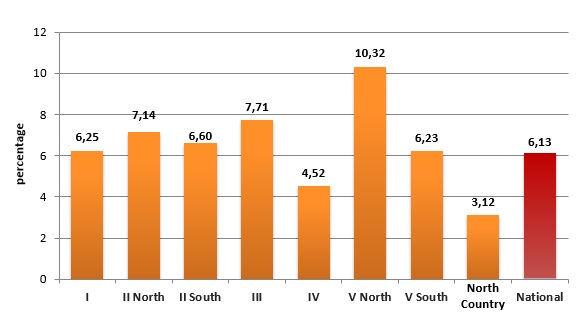
These primary samples had to represent between 100 and 250 ton, and be selected so they reflected the zone production conditions as well as possible, being 4.152 samples used for this sampling program, in such a way a sampled tonnage of 6,13% of the national wheat production, which amounted to 14.510.135 tons, was reached.
|