INTRODUCTION
TRIGO PAN
Triticum aestivum L.
Wheat crop 2012/13 was characterized by the strong effect of the ‘El Niño’ phenomenon, which was developed with strong winds, hail and abundant rain storms, significantly above historical values. The season was neither good for wheat nor for the alternative crops such as barley, chickpea and colza.
| |||||||||||||||||||||||||||||||||||||||||||||||||||||||||||||||||||||||||||||||||||||||
In the central region there were founded leaf diseases and generalized presence of ear Fusarium, even in treated crops. As a result of cloudy days with low radiation, frosts and heat waves at the beginning of November, there was an incomplete grain filling, so there were small grains and grains with Fusarium in variable percentages. All of this affected yields, commercial and industrial quality of grains, and crop production was lesser than expected according to their appearance. In the main wheat region of Argentina, at the south of Buenos Aires province, there was good sanitary crop condition, except for the presence of Leaf Rust.
Yields across the national wheat area were variable, from 1500 to 4000 kg/ha in the central region and from 3500 to 6000 kg/ha in the southern region, with variations according to crops and sub-regions, allowing sustain national estimate performance of 2739 kg/ha, slightly lower to the 2011/2012 crop (2960 kg/ha).
In the central region, quality was highly affected, with low test weights and damages due to Fusarium. On the other hand, in the southern region of Buenos Aires province, grain filling was very good with high values of 1000 grain weight and high hectoliter weights.
The average test weight in the central region was of 75 kg/hl, 4 points below the previous season, also decreased by washing of grains due to rainfalls. The size of grains, given by the weight of 1000 grains, was of 29g, consistent of small and shrunken grains that did not complete their filling, which would affect flour production. In the south of the region, the average value of 1000 grains was 37g, and test weight reached 80 kg/hl.
Protein in the central region was higher than the two previous seasons, with an average of 12.3%, surpassing the trade base of 11% in 1.3%. In the southern region was lower, with an average of 10.7%.
Gluten, directly related to protein, in the central region averaged 29.6%, 5% higher than the previous season, which is a very good value for industry. In the southern region, average was 24.4%. In general, dough showed a moderate baking strength (average W = 256) and a tendency to extensible (average P/L = 0.80).
SAMPLING STRUCTURE
It was agreed to obtain samples which represent about 4,000 tons each, reaching a total of 186 analysis to be performed.
The sampling was planned proportionally to the territorial division (district or department) sown area, and the average yield registered the last three years, according to the ex Secretariat of Agriculture, Livestock, Fishery and Food data. In accordance with the estimated production resulting, the composite sample number to be obtained by each district or department was determined to achieve a proportional representativeness of each locality.
The Argentine Cooperatives Association, the Federation of Country Elevators Association, Argentine Federated Farmers SCL and the Argentine Federation of Milling Industry, through the cooperatives, country elevators and mills selected for each locality, submitted the primary operations samples (trade samples of farmer deliveries) which were starting points to make the locality composite samples, according to instructions given to those in charge of the sampling.
Likewise the National Directorate for Processing and Marketing of Agricultural and Forestry Products. Ministry of Agriculture, Livestock and Fisheries of Argentina bring the support in the sampling.
| |||||||||||||||||||||||||||||||||||||||||||||||||||||||||||||||||
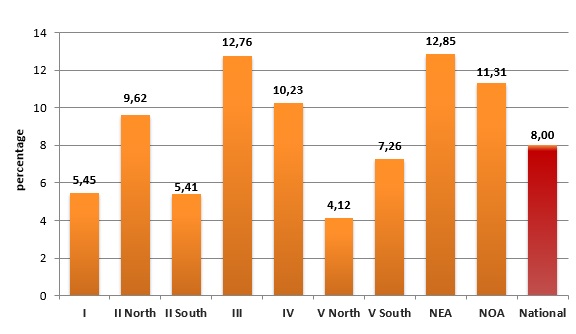
These primary samples had to represent between 100 and 250 ton, and be selected so they reflected the zone production conditions as well as possible, being 2.923 samples used for this sampling program, in such a way a sampled tonnage of 8% of the national wheat production, which amounted to 8.296.444 tons, was reached.
|