INTRODUCTION
WHEAT
Triticum aestivum L.
From the climatic point of view, the year was classified as ‘neutral’ for the “El Niño Southern Oscillation” phenomenon.
| |||||||||||||||||||||||||||||||||||||||||||||||||||||||||||||||||||||||||||||||||||||||
In the Central-Northern region environmental conditions were characterized by a good water supply in the soil profile at sowing, with abundant rains in May. From June rains were scarce, not only in the winter months but also in September and October. Water availability was limiting in the expression of crop yields in some areas. During grain filling stage, approximately from mid-October to mid-November, temperatures were too high for a proper grain growth rate. Average temperatures during the growing season, except for August, were higher than the historical average. Moreover, in August, many days with frosts were recorded, which added up to the lack of rains, generated stress conditions in the crop. October presented a mean of 2.1 ºC over the average, shortening the period of grain filling and affecting its quality. Regarding diseases, no significant levels of incidence or severity in leaves or ears were recorded. In susceptible cultivars, high levels of stem rust (Puccinia graminis) were observed. There was no presence of ear Fusarium. Yields ranged from 500 kg/ha and non-harvested lots in the driest areas, up to 6000 kg/ha in areas with better environmental conditions. Where low yield were registered, the protein content and industrial quality was very good, falling a little in the zones with high yield.
In the Southern region, there were good conditions for sowing, with proper temperature and soil moisture. Crops developed normally, with good tillering and no frosts. In October and November, rains were within the average and temperatures below the historical, causing a delay in heading stage. From the end of November until harvest, there were scarce rains and high temperatures. Long-cycle cultivars had no significant yield losses; conversely, short-cycle cultivars were under water and thermal stress, with yield losses, mainly in shallow soils.
Leaf diseases had little effect. The susceptible varieties had a moderate severity of leaf rust (Puccinia triticina); and stem rust was detected (Puccinia graminis), which justified a chemical control with a good response to the application.
Proper rains and mid-low temperatures at the critical stage of the crop were determinant for the yields. Generally, yields were from average to high, varying according to the areas, rains and technology applied by the producer. The Eastern part of the sub-region had excellent yields, decreasing towards the West, though with a high level. Yields were between 3500 and 6000 kg/ha, with good test weight and excellent grain color.
ESTRUCTURA DE MUESTREO
Se convino en conformar muestras representativas, cada una de alrededor de 4000 toneladas, llegándose a un total de 192 análisis a realizar.
Para obtener un muestreo suficientemente representativo se planificó el mismo en función del área sembrada por cada partido o departamento, y el rendimiento promedio de las últimas tres campañas, según datos del Ministerio de Agricultura, Ganadería y Pesca (MAGyP).
De acuerdo a la producción estimada resultante se determinó el número de muestras conjunto a conformar por partido o departamento, con la intención de lograr una representatividad proporcional de cada localidad.
La Asociación de Cooperativas Argentinas, la Federación de Centros y Entidades Gremiales de Acopiadores de Cereales, Agricultores Federados Argentinos y la Federación Argentina de la Industria Molinera, a través de las cooperativas, acopiadores y molinos seleccionados por localidad, aportaron las muestras de operaciones primarias (muestras comerciales) a partir de las cuales se confeccionarían las muestras conjunto por localidad, según lo indicado en un instructivo dirigido a los responsables del muestreo.
Asimismo, la Dirección de Información Agrícola y Forestal del M.A.G. y P., a través de sus Delegaciones en el interior del país, prestó apoyo en el muestreo y movimiento de muestras.
| ||||||||||||||||||||||||||||||||||||||||||||||||||||||||||||
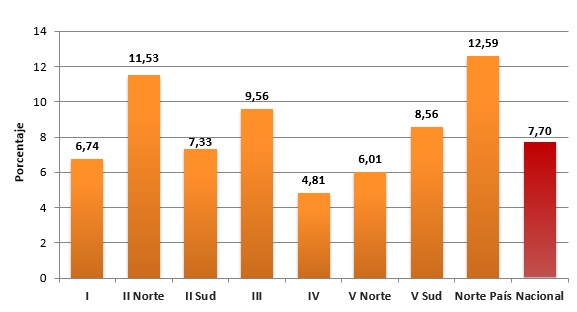
Estas muestras primarias debían representar entre 100 y 250 tn, y ser seleccionadas de manera de reflejar lo mejor posible las características de la producción de la zona, utilizándose en total 3.121 muestras con destino al presente relevamiento con lo que se llega a un tonelaje muestreado de 7,70% de la producción nacional de trigo pan que alcanzó las 9.107.039 toneladas.
|