INTRODUCTION
WHEAT
Triticum aestivum L.
2014/2015 growing season in Argentina saw a significant increase in wheat acreage, with a total production of 13.8 Mt, up 25% from the previous season. Acreage was 5.04 million hectares, up from 3.65 million hectares. Average yield was 2,915 kg/ha.
| |||||||||||||||||||||||||||||||||||||||||||||||||||||||||||||||||||||||||||||||||||||||
Temperatures were above normal, followed by heavy frosts. There were losses due to stem damage in some wheat varieties and plots. The presence of foliar diseases, predominantly wheat leaf rust and, to a lesser extent, yellow leaf spot and Septoria leaf blotch required up to two treatments. Some regions were affected by wheat aphids. There was some fusarium ear blight in sub-regions I, II, IIN and IIS.
The intense heat of October negatively impacted on grain filling, chiefly in later plots, and led to smaller grains. Test weight and 1000-grain weight were lower, due to shorter grain filling, which cause harvest to start earlier. Weather conditions and diseases affected yields. Based on initial plot conditions and farmers' expectations, yields were expected to be higher.
Nitrogen assimilation in the soil was not efficient, neither was nitrogen translocation from the leaves to the grain. This affected yield and industrial quality with generally low protein and gluten content.
Sub-region IV, the major wheat growing area in the country, featured mid to high yields. Differences depended upon rainfall, disease control and technologies applied. Yields ranged from 3,000 to 6,000 kg/hectare, with different test weights, good 1000-grain weight and nice color.
SAMPLING STRUCTURE
It was agreed to obtain samples which represent about 4,000 tons each, reaching a total of 246 analysis to be performed. The sampling was planned proportionally to the territorial division (district or department) sown area, and the average yield registered the last three years, according to the ex Secretariat of Agriculture, Livestock, Fishery and Food data. In accordance with the estimated production resulting, the composite sample number to be obtained by each district or department was determined to achieve a proportional representativeness of each locality.
The Argentine Cooperatives Association, the Federation of Country Elevators Association, Argentine Federated Farmers SCL and the Argentine Federation of Milling Industry, through the cooperatives, country elevators and mills selected for each locality, submitted the primary operations samples (trade samples of farmer deliveries) which were starting points to make the locality composite samples, according to instructions given to those in charge of the sampling.
Likewise the National Directorate for Processing and Marketing of Agricultural and Forestry Products. Ministry of Agriculture, Livestock and Fisheries of Argentina bring the support in the sampling.
| |||||||||||||||||||||||||||||||||||||||||||||||||||||||||||||||||
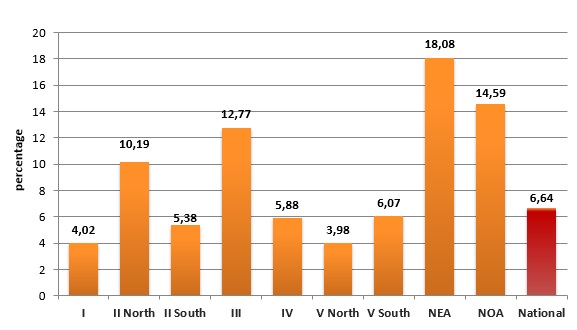
These primary samples had to represent between 100 and 250 ton, and be selected so they reflected the zone production conditions as well as possible, being 3.564 samples used for this sampling program, in such a way a sampled tonnage of 6,64% of the national wheat production, which amounted to 13.794.868 tons, was reached.
|