INTRODUCTION
WHEAT
Triticum aestivum L.
In the 2015-2016 growing season, wheat grain yields were good but protein contents were unprecedentedly low. There have never been such low protein levels in Argentina.
| |||||||||||||||||||||||||||||||||||||||||||||||||||||||||||||||||||||||||||||||||||||||
National production is estimated at 11.26 million tons; down 12.3% from the 2014/2015 season’s 13.79 million tons. 4.35 million hectares were planted and 3.93 were harvested. Average national yield was 2.864 kg/h, down 51 kg/h from the national average of recent growing seasons.
It was a warmer year with very little frost, when compared to historical statistics.
Diseases were reported in the center and north, but not in the south of the wheat growing area. Pests spread thanks to favorable humidity and temperatures, which added to cultivars’ lack of genetic resistance. Pest infestation occurred early and continued along the cycle. There were severe cases of leaf rust (Puccinia triticina) and of stem rust (Puccina graminis) and some yellow spot and wheat fusarium head blight. Infestation negatively impacted on yields and on the grain commercial quality.
Little technology was applied resulting in large differences of minimum and maximum yields in the same region. Protein and gluten contents were also affected: high percentages of white belly (low protein index) due to little or no N fertilization, bleaching or N washing. Nitrogen level was below average due to heavy rains produced by El Niño, high water tables, cloudy and cool days when grain was filling.
The central area of the country suffered heavy rains that negatively affected harvest, reduced grain weight and, in some cases, hail led to total loss of the crop.
SAMPLING STRUCTURE
It was agreed to obtain samples which represent about 4,000 tons each, reaching a total of 230 analysis to be performed. The sampling was planned proportionally to the territorial division (district or department) sown area, and the average yield registered the last three years, according to the ex Secretariat of Agriculture, Livestock, Fishery and Food data. In accordance with the estimated production resulting, the composite sample number to be obtained by each district or department was determined to achieve a proportional representativeness of each locality.
The Argentine Cooperatives Association, the Federation of Country Elevators Association, Argentine Federated Farmers SCL and the Argentine Federation of Milling Industry, through the cooperatives, country elevators and mills selected for each locality, submitted the primary operations samples (trade samples of farmer deliveries) which were starting points to make the locality composite samples, according to instructions given to those in charge of the sampling.
Likewise the National Directorate for Processing and Marketing of Agricultural and Forestry Products. Ministry of Agriculture, Livestock and Fisheries of Argentina bring the support in the sampling.
| |||||||||||||||||||||||||||||||||||||||||||||||||||||||||||||||||
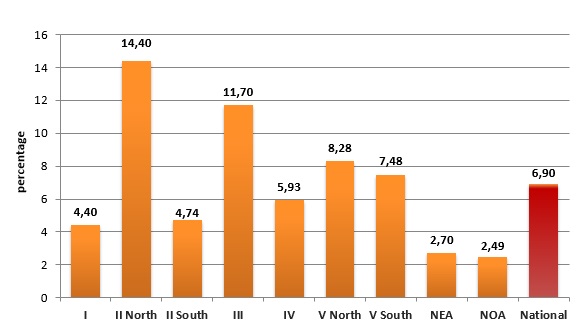
These primary samples had to represent between 100 and 250 ton, and be selected so they reflected the zone production conditions as well as possible, being 3.137 samples used for this sampling program, in such a way a sampled tonnage of 6,90% of the national wheat production, which amounted to 11.260.482 tons, was reached.
|