


 SUBREGION I
The sown surface was slightly larger than that of the campaign 2010/2011 mainly due to the proper humidity existing in the soil profile, to assure a good stand and emerging of the plants. The sowings started by the end of April (a small number) and continued throughout the months of May, June and July (the majority), in some zones at the East being delayed due to the water excess that made the labor difficult.
The beginning of the plant cycle had a good stand and emergence of the plants. During the first half of August, the humidity conditions maintained proper, allowing a normal development of the crops at the tilling stage, in which programmed re-fertilizations were done, verifying a good coverage of the plants.
Lack of rains in various zones during September produced a decrease in the humidity reserves in the middle of the stem stage, which started to affect the crops manifesting symptoms of water-stress, such as yellow base leaves and yellow tips of the higher leaves. The timely rains registered at the beginning of October resulted highly beneficial for the recovery of the crops in the reproductive stages with larger demands of water. The continuity of weekly rains during October favored the filling of the grains, and the rains retreated in November, allowing a normal culmination of the cycle with good performances in general.
Sanitary condition was good, although in some zones there were fields slightly affected by yellow spot, septoria and rust. There were mites in fields of some zones that were then chemically treated.
Final average yields per department varied in a range of around 2,600 and 3,500 kg/ha, and some fields stood out with maximum yields of 4,000 to 4,500 kg/ha.
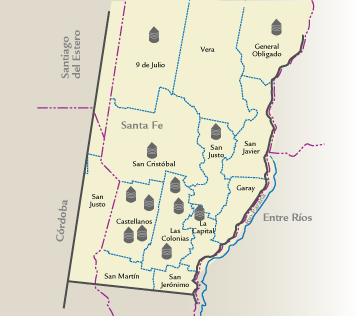
| MAP OF THE SUBREGION |
|
| ||||||||||||||||||||||||||||||||||||||||||||||||||||||||||||||||||||||
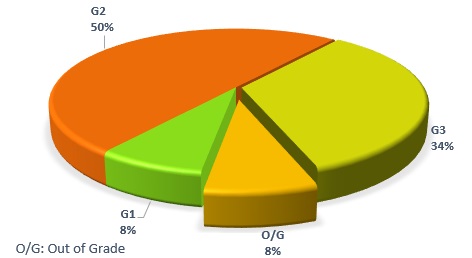
| GRADE DISTRIBUTION |
|
| FLOUR ANALYSIS | PARAMETERS | MINIMUM | MAXIMUM | AVERAGE | STANDARD DEVIATION | VARIATION COEFFICIENT | |||
| MILLING | Wet Gluten (%) | 19,2 | 27,8 | 23,8 | 2,4 | ,87 | |||
| Dry Gluten (%) | 6,9 | 9,5 | 8,0 | 0,8 | 9,87 | ||||
| Falling Number (sec.) | 386 | 491 | 448 | 32 | 7,22 | ||||
| Flour Yield(%) | 68,5 | 73,8 | 71,6 | 1,8 | 2,47 | ||||
| Ash (dry basis) (%) | 0,555 | 0,765 | 0,682 | 0,066 | 9,75 | ||||
| FARINOGRAM | Water Absorption(14 % H°) (%) | 54,6 | 63,4 | 57,8 | 2,3 | ,00 | |||
| Development Time (min.) | 1,6 | 10,4 | 6,1 | 3,3 | 54,78 | ||||
| Stability (min.) | 2,0 | 19,5 | 11,2 | 6,4 | 56,72 | ||||
| Degree of Softening (12 min.) | 29 | 67 | 46 | 10 | 21,94 | ||||
| P (mm) | 68 | 123 | 98 | 18 | 18,42 | ||||
| ALVEOGRAM | |||||||||
| L (mm) | 49 | 110 | 73 | 17 | 23,82 | ||||
| W Joules x 10-4 | 196 | 303 | 251 | 31 | 12,43 | ||||
| P / L | 0,66 | 2,51 | 1,33 | 0,53 | 36,55 | ||||
| These results were elaborated with 12 composite samples prepared proportionally from 252 primary samples (farmer deliveries). | |||||||||
SUBREGION DATA
In this sub region the wheat production was 1,005,980 tons., the 7.8% of the national total. Were sampled 49,760 tons., the 4.9 % of the sub region production.
| APPENDIX OF LOCALITY COMPOSITE SAMPLES | |||||||||||||
| SAMPLE IDENTIFICATION | WHEAT ANALYSIS | ||||||||||||
| SAMPLE NUMBER | LOCALITY, DISTRICT OR DEPARTMENT | TONNAJE | GRADE | TEST WEIGT (Kg/hl) | TOTAL DAMAGED KERNELS(%) | FOREIGN MATERIAL (%) |
SHRUNKEN AND BROKEN KERNELS (%) | YELLOW BERRY KERNELS(%) | PROTEIN (MOISTURE 13,5 % H°) |
PROTEIN (s/S.S.S.) | WEIGT OF 1000 KERNELS | ASH(dry basis)(%) | |
| 1 | Gral. Obligado | 5780 | 2 | 77,40 | 0,58 | 0,06 | 0,46 | 2,10 | 9,4 | 10,9 | 30,90 | 1,867 | |
| 2 | San Justo (S.Fe) | 24120 | 1 | 79,30 | 0,20 | 0,14 | 0,60 | 0,00 | 10,4 | 12,0 | 33,90 | 1,810 | |
| 3 | La Capital | 2050 | 2 | 77,00 | 0,40 | 0,56 | 0,40 | 0,00 | 10,8 | 12,5 | 33,5 | 1,634 | |
| 4 | 9 de Julio | 5900 | 2 | 76,70 | 0,26 | 0,16 | 0,82 | 0,00 | 10,4 | 12,0 | 32,80 | 1,970 | |
| 5 | San Cristóbal | 3990 | 2 | 76,00 | 0,38 | 0,48 | 0,50 | 0,00 | 10,8 | 12,5 | 31,00 | 1,913 | |
| 6 | Castellanos | 3900 | 2 | 77,30 | 0,46 | 0,22 | 0,66 | 0,00 | 10,4 | 12,0 | 32,10 | 1,937 | |
| 7 | Castellanos | 4050 | 3 | 75,30 | 0,50 | 0,10 | 0,64 | 0,00 | 11,4 | 13,2 | 33,80 | 1,882 | |
| 8 | Castellanos | 4200 | 3 | 74,70 | 0,44 | 0,16 | 0,36 | 0,00 | 11,1 | 12,8 | 31,20 | 1,866 | |
| 9 | Castellanos | 3970 | FE | 72,50 | 0,54 | 0,20 | 0,54 | 0,0 | 10,7 | 12,4 | 31,60 | 1,872 | |
| 10 | Las Colonias | 3950 | 2 | 76,00 | 0,74 | 0,26 | 0,66 | 0,00 | 10,5 | 12,1 | 32,80 | 1,638 | |
| 11 |
| 3800 | 3 | 75,40 | 0,70 | 0,08 | 0,34 | 0,00 | 11,3 | 13,1 | 34,20 | 1,675 | |
| 12 |
| 4050 | 3 | 73,80 | 0,26 | 0,64 | 0,68 | 0,00 | 10,3 | 11,9 | 30,90 | 1,645 | |
| APPENDIX OF LOCALITY COMPOSITE SAMPLES | |||||||||||||||
| SAMPLE IDENTIFICATION | FLOUR ANALYSIS | ||||||||||||||
| SAMPLE NUMBER | LOCALITY, DISTRICT OR DEPARTMENT | WET GLUTEN (%) | DRY GLUTEN(%) | FALLING NUMBER (sec.) | FLOUR YIELD(%) | FARINOGRAM | ALVEOGRAM | ASH(dry basis)(%) | |||||||
| D. T. (min.) | STABILITY (min.) | DEGREE SOFTENING(12 min.) | P | L | W | P/ | |||||||||
| 1 | Gral. Obligado | 19,2 | 6,9 | 386 | 68,5 | 56,8 | 1,6 | 2,0 | 67 | 114 | 57 | 262 | 2,00 | 0,555 | |
| 2 | San Justo | 27,8 | 9,5 | 439 | 70,0 | 63,4 | 6,4 | 7,3 | 52 | 116 | 65 | 258 | 1,78 | 0,625 | |
| 3 | La Capital | 24,5 | 8,4 | 417 | 70,0 | 60,0 | 10, | 17,2 | 41 | 102 | 80 | 299 | 1,28 | 0,595 | |
| 4 | 9 de Julio | 23,0 | 7,8 | 420 | 71,4 | 59,4 | 9,1 | 18,1 | 36 | 113 | 72 | 303 | 1,57 | 0,695 | |
| 5 | San Cristóbal | 23,1 | 7,7 | 430 | 70,4 | 56,9 | 9,2 | 18,2 | 38 | 102 | 74 | 266/td> | 1,38 | 0,625 | |
| 6 | Castellanos | 21,6 | 7,2 | 484 | 70,1 | 60,1 | 10,4 | 12,9 | 47 | 123 | 49 | 242 | 2,51 | 0,715 | |
| 7 | Castellanos | 24,3 | 7,5 | 452 | 72,0 | 56,7 | 7,9 | 14,4 | 45 | 73 | 110 | 263 | 0,66 | 0,695 | |
| 8 | Castellanos | 24,1 | 7,7 | 491 | 73,2 | 55,3 | 9,0 | 19,5 | 29 | 91 | 51 | 196 | 1,78 | 0,745 | |
| 9 | Castellanos | 23,5 | 8,0 | 465 | 73,8 | 54,6 | 2,1 | 8,1 | 47 | 68 | 88 | 203 | 0,77 | 0,685 | |
| 10 | Las Colonias | 24,5 | 8,3 | 481 | 73,6 | 58,2 | 2,0 | 3,1 | 50 | 96 | 72 | 259 | 1,33 | 0,765 | |
| 11 |
| 26,4 | 8,9 | 473 | 73,6 | 56,4 | 6,1 | 14,3 | 46 | 72 | 99 | 228 | 0,73 | 0,725 | |
| 12 |
| 26,6 | 9,3 | 463 | 72,9 | 57,0 | 2,0 | 3,5 | 54 | 87 | 75 | 234 | 1,16 | 0,765 | |