


 SUBREGION I
Planting was from late May to the second half of July, under adequate soil moisture levels. In Castellanos and Las Colonias Departments, planting was challenging and a bit delayed due to excess moisture and high water tables resulting from the abundant rains along April 2016. Therefore, planting could not follow the planned schedule in some areas.
Farmers resorted to conventional tillage to level the soil and compensate the effect of harvester damage in plots with excess water.
Plant emergence and stand were adequate, and crop developed properly in the fields.
N fertilizers use increased at planting. A second rate was applied at tillering. The use of technology was also very significant.
August and September rains were irregular, insufficient in certain areas, which affected crop growth at tillering and stem extension.
Yellow spot and orange rust were detected with variable intensities, depending on the area and wheat variety. October rains were very timely and beneficial; they allowed excellent flowering and grain filling and positively impacted on yields.
LHarvest was on regular dates and without issues, from mid-November to December.
Yields ranged from 2,000 to 4,000 kg/ha.
Grain commercial quality was good, with adequate test weights.
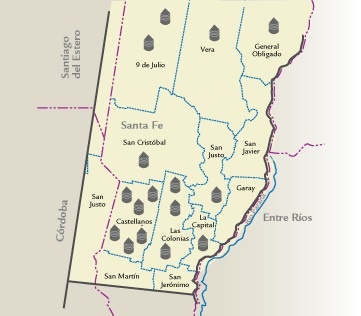
| MAP OF THE SUBREGION |
|
| |||||||||||||||||||||||||||||||||||||||||||||||||||||||||||||||||||||||
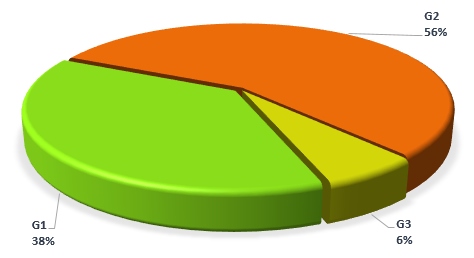
| GRADE DISTRIBUTION |
|
| FLOUR ANALYSIS | PARAMETERS | MINIMUM | MAXIMUM | AVERAGE | STANDARD DEVIATION | VARIATION COEFFICIENT | |||
| MILLING | Wet Gluten (%) | 17,3 | 27,9 | 23,8 | 2,6 | 11,05 | |||
| Dry Gluten (%) | 6,2 | 9,7 | 8,5 | 0,9 | 10,54 | ||||
| Falling Number (sec.) | 330 | 508 | 424 | 45 | 10,61 | ||||
| Flour Yield (%) | 47,0 | 51,0 | 49,3 | 1,4 | 2,84 | ||||
| Ash (dry basis) (%) | 0,538 | 0,742 | 0,645 | 0,059 | 9,21 | ||||
| FARINOGRAM | Water Absorption(14 % H°) (%) | 51,7 | 55,5 | 54,0 | 1,0 | 1,84 | |||
| Development Time (min.) | 5,2 | 8,0 | 6,3 | 0,8 | 12,83 | ||||
| Stability (min.) | 8,6 | 16,3 | 11,8 | 2,3 | 19,65 | ||||
| Degree of Softening (12 min.) | 29 | 67 | 48 | 10 | 21,61 | ||||
| ALVEOGRAM | |||||||||
| P (mm) | 47 | 88 | 75 | 8 | 10,36 | ||||
| L (mm) | 61 | 115 | 89 | 14 | 15,29 | ||||
| W Joules x 10-4 | 154 | 275 | 227 | 26 | 11,65 | ||||
| P / L | 0,43 | 1,44 | 0,84 | 0,20 | 24,38 | ||||
| These results were elaborated with 16 composite samples prepared proportionally from 344 primary samples (farmer deliveries) | |||||||||
SUBREGION DATA
In this sub region the wheat production was 1.596.706 tons., the 8.6% of the national total. Were sampled 58.020 tons., the 3.6% of the sub region production.
| APPENDIX OF LOCALITY COMPOSITE SAMPLES | |||||||||||||
| SAMPLE IDENTIFICATION | WHEAT ANALYSIS | ||||||||||||
| SAMPLE NUMBER | LOCALITY, DISTRICT OR DEPARTMENT | TONNAJE | GRADE | TEST WEIGT (Kg/hl) | TOTAL DAMAGED KERNELS(%) | FOREIGN MATERIAL (%) | SHRUNKEN AND BROKEN KERNELS(%) | YELLOW BERRY KERNELS (%) | PROTEIN(MOISTURE 13,5 % H°) | PROTEIN(s/S.S.S.) | WEIGT OF 1000 KERNELS | ASH(dry basis) % | |
| 1 | General Obligado | 4820 | 3 | 81,30 | 0,32 | 0,06 | 0,28 | 30,80 | 8,9 | 10,3 | 40,60 | 1,896 | |
| 2 | 9 de Julio | 3460 | 1 | 81,00 | 0,70 | 0,14 | 0,20 | 10,20 | 10,5 | 12,1 | 34,34 | 1,775 | |
| 3 | 9 de Julio | 3710 | 1 | 79,50 | 0,40 | 0,08 | 0,62 | 11,80 | 10,2 | 11,8 | 30,82 | 1,852 | |
| 4 | Vera | 2300 | 1 | 82,10 | 0,30 | 0,10 | 0,40 | 4,10 | 10,1 | 11,7 | 37,56 | 1,731 | |
| 5 | Castellanos | 3750 | 2 | 80,30 | 0,64 | 0,20 | 0,80 | 7,00 | 10,5 | 12,1 | 33,62 | 1,772 | |
| 6 | Castellanos | 4210 | 2 | 80,80 | 0,48 | 0,50 | 0,48 | 11,60 | 9,9 | 11,4 | 33,70 | 1,785 | |
| 7 | Castellanos | 3990 | 2 | 80,10 | 0,44 | 0,14 | 0,56 | 6,60 | 10,1 | 11,7 | 33,20 | 1,738 | |
| 8 | Castellanos | 3680 | 2 | 79,40 | 0,46 | 0,30 | 0,60 | 5,20 | 10,4 | 12,0 | 33,75 | 1,752 | |
| 9 | Castellanos | 3850 | 1 | 81,10 | 0,46 | 0,36 | 1,00 | 6,50 | 10,8 | 12,5 | 33,64 | 1,766 | |
| 10 |
| 3480 | 2 | 80,50 | 0,50 | 0,74 | 0,36 | 10,00 | 10,1 | 11,7 | 32,50 | 1,788 | |
| 11 |
| 2070 | 1 | 82,40 | 0,38 | 0,48 | 0,58 | 11,20 | 9,7 | 11,2 | 34,56 | 1,697 | |
| 12 |
| 3780 | 2 | 82,40 | 0,46 | 0,20 | 0,60 | 12,80 | 9,7 | 11,2 | 36,20 | 1,748 | |
| 13 |
| 3950 | 1 | 79,60 | 0,44 | 0,26 | 0,48 | 8,40 | 10,1 | 11,7 | 37,54 | 1,712 | |
| 14 |
| 4150 | 2 | 79,50 | 0,58 | 0,56 | 1,20 | 7,00 | 10,6 | 12,3 | 36,66 | 1,736 | |
| 15 |
| 1790 | 2 | 78,00 | 0,22 | 0,10 | 0,40 | 8,00 | 9,7 | 11,2 | 34,28 | 1,810 | |
| 16 |
| 5030 | 2 | 81,40 | 0,36 | 0,74 | 0,64 | 7,40 | 10,6 | 12,3 | 36,40 | 1,696 | |
| APPENDIX OF LOCALITY COMPOSITE SAMPLES | |||||||||||||||
| SAMPLE IDENTIFICATION | FLOUR ANALYSIS | ||||||||||||||
| SAMPLE NUMBER | LOCALITY, DISTRICT OR DEPARTMENT | WET GLUTEN(%) | DRY GLUTEN(%) | FALLING NUMBER (sec.) | FLOUR YIELD(%) | FARINOGRAM | ALVEOGRAM | ASH(dry basis)(%) | |||||||
| % WA (14 % H°) | D. T. (min.) | STABILITY (min.) | DEGREE SOFTENING(12 min.) | P | L | W | P/L | ||||||||
| 1 | General Obligado | 17,3 | 6,2 | 330 | 49,0 | 54,4 | 6,0 | 10,2 | 63 | 78 | 68 | 189 | 1,15 | 0,538 | |
| 2 | 9 de Julio | 27,9 | 9,7 | 385 | 47,0 | 55,5 | 5,5 | 8,6 | 67 | 68 | 90 | 207 | 0,76 | 0,670 | |
| 3 | 9 de Julio | 21,3 | 7,7 | 508 | 47,0 | 52,0 | 6,0 | 16,3 | 31 | 75 | 78 | 209 | 0,96 | 0,592 | |
| 4 | Vera | 23,8 | 8,7 | 375 | 48,0 | 53,9 | 6,0 | 14,7 | 29 | 78 | 101 | 252 | 0,77 | 0,561 | |
| 5 | Castellanos | 23,9 | 8,6 | 444 | 51,0 | 53,9 | 7,3 | 14,1 | 44 | 80 | 85 | 247 | 0,94 | 0,742 | |
| 6 | Castellanos | 23,1 | 8,0 | 434 | 50,0 | 53,2 | 5,6 | 11,5 | 46 | 87 | 94 | 275 | 0,93 | 0,694 | |
| 7 | Castellanos | 24,9 | 9,0 | 449 | 50,0 | 53,7 | 6,0 | 10,9 | 47 | 77 | 75 | 211 | 1,03 | 0,732 | |
| 8 | Castellanos | 23,4 | 8,5 | 416 | 51,0 | 53,5 | 8,0 | 16,2 | 33 | 79 | 82 | 242 | 0,96 | 0,650 | |
| 9 | Castellanos | 27,1 | 9,5 | 461 | 50,0 | 55,0 | 5,8 | 11,1 | 46 | 76 | 102 | 259 | 0,75 | 0,687 | |
| 10 | Castellanos | 24,2 | 8,6 | 386 | 49,0 | 53,4 | 6,0 | 10,9 | 49 | 74 | 94 | 231 | 0,79 | 0,705 | |
| 11 | La Capital | 21,3 | 7,6 | 459 | 48,0 | 53,4 | 7,9 | 14,4 | 38 | 88 | 61 | 204 | 1,44 | 0,621 | |
| 12 | Las Colonias | 22,3 | 7,9 | 411 | 50,0 | 53,8 | 7,1 | 10,9 | 55 | 75 | 88 | 226 | 0,85 | 0,602 | |
| 13 | Las Colonias | 24,8 | 9,0 | 449 | 49,0 | 55,1 | 6,2 | 11,7 | 44 | 81 | 81 | 228 | 1,00 | 0,588 | |
| 14 | Las Colonias | 26,6 | 9,2 | 478 | 51,0 | 54,8 | 5,2 | 8,6 | 54 | 63 | 115 | 213 | 0,55 | 0,631 | |
| 15 | San Cristóbal | 23,2 | 8,4 | 409 | 48,0 | 51,7 | 5,9 | 9,3 | 58 | 47 | 110 | 154 | 0,43 | 0,682 | |
| 16 | San Justo | 24,9 | 9,0 | 394 | 51,0 | 55,2 | 7,2 | 11,5 | 57 | 72 | 98 | 241 | 0,73 | 0,630 | |