


 SUBREGION I
Wheat planted area was less than last season, being this surface partially covered by other winter crops. Sowing time was the normal one and with proper soil moisture reserves, which extended from May up to the first half of July.
At tillering stage weather was dry and cold with successive frosts. The rains registered in the second half of August resulted beneficial to allow a good crop recovery and the refill of the moisture reserves. There was a good evolution during the stages of tilling-stem elongation, with a good number of tillers, uniformity and proper leaf coverage. However, in the last week of September, late frosts were registered, which caused damages to ears. During October, accumulated rains ranged between 150 and 300 millimeters, surpassing in most localities normal values for that month, and in many cases doubling them.
Due to humidity excess conditions, there were diseases such as Fusarium, Yellow Spot, Septoriosis, Orange and Leaf Rust, and several degrees of affectation were verified both in leaf area and in grains per ear. Besides, during the mentioned period of rains, hail occurred in specific sectors partially affecting the crops.
Harvest was carried out mainly in November and yields were highly variable and below expectations, with minimum of 1000 kg/ha and maximum of 3000 kg/ha, with an average close of 2500 kg/ha.
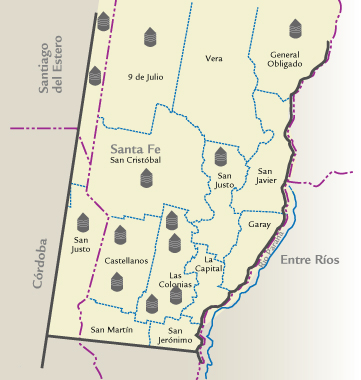
| MAP OF THE SUBREGION |
|
| ||||||||||||||||||||||||||||||||||||||||||||||||||||||||||||||||||||||
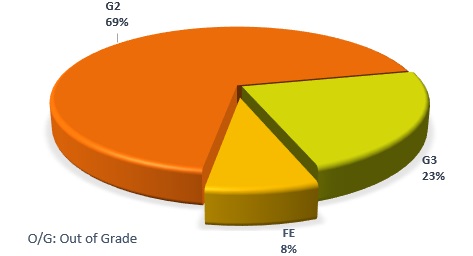
| GRADE DISTRIBUTION |
|
| FLOUR ANALYSIS | PARAMETERS | MINIMUM | MAXIMUM | AVERAGE | STANDARD DEVIATION | VARIATION COEFFICIENT | |||
| MILLING | Wet Gluten (%) | 23,0 | 34,9 | 29,5 | 3,2 | 10,79 | |||
| Dry Gluten (%) | 8,0 | 12,0 | 10,0 | 1,3 | 13,34 | ||||
| Falling Number (sec.) | 226 | 497 | 412 | 65 | 15,85 | ||||
| Flour Yield(%) | 67,5 | 74,9 | 71,3 | 1,8 | 2,57 | ||||
| Ash (dry basis) (%) | 0,605 | 0,885 | 0,775 | 0,089 | 11,51 | ||||
| FARINOGRAM | Water Absorption(14 % H°) (%) | 56,1 | 61,6 | 58,3 | 1,5 | 2,62 | |||
| Development Time (min.) | 2,1 | 13,2 | 7,0 | 3,0 | 43,10 | ||||
| Stability (min.) | 3,4 | 20,9 | 9,7 | 4,8 | 49,57 | ||||
| Degree of Softening (12 min.) | 33 | 207 | 110 | 59 | 53,27 | ||||
| P (mm) | 63 | 92 | 73 | 9 | 11,67 | ||||
| ALVEOGRAM | |||||||||
| L (mm) | 74 | 119 | 97 | 12 | 12,00 | ||||
| W Joules x 10-4 | 158 | 303 | 226 | 34 | 15,26 | ||||
| P / L | 0,53 | 1,00 | 0,75 | 0,15 | 19,45 | ||||
| These results were elaborated with 13 composite samples prepared proportionally from 177 primary samples (farmer deliveries) | |||||||||
SUBREGION DATA
In this sub region the wheat production was 831.950 tons., the 10,0% of the national total. Were sampled 45,350 tons., the 5,45% of the sub region production.
| APPENDIX OF LOCALITY COMPOSITE SAMPLES | |||||||||||||
| SAMPLE IDENTIFICATION | WHEAT ANALYSIS | ||||||||||||
| SAMPLE NUMBER | LOCALITY, DISTRICT OR DEPARTMENT | TONNAJE | GRADE | TEST WEIGT (Kg/hl) | TOTAL DAMAGED KERNELS(%) | FOREIGN MATERIAL (%) |
SHRUNKEN AND BROKEN KERNELS (%) | YELLOW BERRY KERNELS(%) | PROTEIN (MOISTURE 13,5 % H°) |
PROTEIN (s/S.S.S.) | WEIGT OF 1000 KERNELS | ASH(dry basis)(%) | |
| 1 | Gral. Obligado | 2920 | 2 | 80,50 | 1,14 | 0,10 | 0,66 | 8,80 | 11,4 | 13,2 | 29,70 | 1,995 | |
| 2 | 9 de Julio | 2860 | 2 | 80,20 | 0,62 | 0,32 | 0,40 | 2,50 | 12,2 | 14,1 | 32,26 | 2,214 | |
| 3 | Las Colonias | 3700 | 3 | 74,50 | 0,76 | 0,46 | 0,70 | 1,80 | 11,6 | 13,4 | 29,18 | 2,005 | |
| 4 | Las Colonias | 3920 | 3 | 75,70 | 1,60 | 0,02 | 0,92 | 1,10 | 11,3 | 13,1 | 29,54 | 2,161 | |
| 5 | Las Colonias | 4020 | F/E | 75,00 | 3,46 | 0,28 | 0,32 | 0,00 | 11,4 | 13,2 | 29,48 | 1,875 | |
| 6 | Las Colonias | 3950 | 3 | 78,40 | 2,82 | 0,66 | 0,94 | 0,00 | 12,5 | 14,5 | 29,80 | 2,187 | |
| 7 | San Cristóbal | 1130 | 3 | 76,70 | 1,02 | 0,06 | 1,40 | 0,00 | 12,0 | 13,9 | 27,72 | 1,988 | |
| 8 | San Justo | 1980 | 3 | 75,20 | 2,64 | 0,40 | 1,00 | 0,00 | 13,0 | 15,0 | 32,20 | 1,873 | |
| 9 | Castellanos | 4310 | 3 | 78,10 | 2,22 | 0,40 | 0,46 | 0,00 | 11,8 | 13,6 | 29,88 | 1,787 | |
| 10 | Castellanos | 4800 | 3 | 76,90 | 2,40 | 0,24 | 0,32 | 0,00 | 11,9 | 13,8 | 28,68 | 1,975 | |
| 11 |
| 3760 | 2 | 79,50 | 1,94 | 0,18 | 0,56 | 4,50 | 11,8 | 13,6 | 30,80 | 1,948 | |
| 12 |
| 4000 | 3 | 77,90 | 0,36 | 0,10 | 1,52 | 0,26 | 12,9 | 14,9 | 27,66 | 2,002 | |
| 13 |
| 4000 | 3 | 78,60 | 0,40 | 0,26 | 1,34 | 2,24 | 12,8 | 14,8 | 28,60 | 2,099 | |
| APPENDIX OF LOCALITY COMPOSITE SAMPLES | |||||||||||||||
| SAMPLE IDENTIFICATION | WHEAT ANALYSIS | ||||||||||||||
| SAMPLE NUMBER | LOCALITY, DISTRICT OR DEPARTMENT | WET GLUTEN(%) | DRY GLUTEN(%) | FALLING NUMBER (sec.) | FLOUR YIELD(%) | FARINOGRAM | ALVEOGRAM | ASH(dry basis)(%) | |||||||
| % AA (14 % H°) | T, D, (min.) | STABILITY (min.) | DEGREE SOFTENING(12 min.) | P | L | W | P/L | ||||||||
| 1 | Gral. Obligado | 26,6 | 8,3 | 419 | 72,4 | 58,1 | 7,1 | 9,2 | 92 | 92 | 303 | 1,00 | 0,765 | ||
| 2 | 9 de Julio | 26,4 | 9,0 | 398 | 73,4 | 59,6 | 6,9 | 7,2 | 99 | 79 | 102 | 263 | 0,77 | 0,885 | |
| 3 | Las Colonias | 25,3 | 8,7 | 226 | 71,4 | 59,1 | 4,5 | 4,2 | 207 | 74 | 91 | 205 | 0,81 | 0,725 | |
| 4 | Las Colonias | 25,4 | 8,2 | 435 | 74,9 | 60,1 | 4,1 | 3,4 | 196 | 71 | 74 | 158 | 0,96 | 0,885 | |
| 5 | Las Colonias | 33,9 | 11,3 | 367 | 68,0 | 60,5 | 5,8 | 6,5 | 98 | 63 | 119 | 223 | 0,53 | 0,755 | |
| 6 | Las Colonias | 28,5 | 9,3 | 429 | 70,6 | 56,8 | 4,5 | 8,4 | 71 | 67 | 108 | 219 | 0,62 | 0,625 | |
| 7 | San Cristóbal | 23,0 | 8,0 | 420 | 71,0 | 57,4 | 2,1 | 9,0 | 77 | 87 | 91 | 264 | 0,96 | 0,605 | |
| 8 | San Justo | 34,9 | 11,4 | 405 | 67,5 | 61,6 | 4,8 | 4,7 | 82 | 65 | 115 | 205 | 0,57 | 0,815 | |
| 9 | Castellanos | 31,7 | 10,5 | 497 | 71,0 | 56,1 | 5,2 | 10,5 | 60 | 64 | 92 | 191 | 0,70 | 0,825 | |
| 10 | Castellanos | 28,2 | 9,5 | 475 | 71,7 | 56,7 | 13,2 | 14,0 | 196 | 73 | 94 | 236 | 0,78 | 0,645 | |
| 11 | San Justo (Cba.) | 29,7 | 9,9 | 425 | 72,8 | 58,1 | 6,4 | 8,7 | 107 | 68 | 105 | 223 | 0,65 | 0,805 | |
| 12 | Selva | 32,3 | 12,0 | 435 | 71,4 | 57,6 | 11,3 | 20,9 | 33 | 87 | 88 | 258 | 0,99 | 0,878 | |
| 13 | Bandera | 32,0 | 11,9 | 399 | 70,4 | 58,2 | 8,8 | 13,5 | 53 | 73 | 98 | 233 | 0,74 | 0,812 | |