


 SUBREGION II NORTH
Wheat crop during the year 2011 was benefited from the good water refill of the soil profile, due to the rains occurred during the period of the end of summer-fall. The most significant contribution of 2011 was given by the rains occurred in the last decade of May and June that reached 86 mm. These conditions were the ones that permitted the crop during the stage of emergence up to the end of tilling to have proper useful water availability in the soil profile, not being a limit for the expression of the yields.
Total rains fallen during the crop cycle (May to November) was 375 mm, with 45 mm more than the historical value of the last 20 years.
The number of days with frosts was 51 during the crop cycle, and the more frequent occurrence was during June, July and August. In the sub-region II North the frosts damaged crops with and advanced reproductive stage, which led to a significant fall in the grain production.
The growing and development of the crop were affected by high temperatures registered during crucial moments for the production and quality, such as pre-anthesis, anthesis and grain filling (September-October-November).
The percentage of severity of the foliar diseases, measured in the stage of flag leaf was low and yellow spot was the disease with higher incidence.
There were predisposing conditions for ear fusariosis and there were important differences in incidence and severity among the assessed genotypes.
The rose-green aphid of the cereals was the most common plague and the levels reached during the stage of flag leaf and earing surpassed the limit of economic damage.
Yields in the area ranged from good to very good, higher than the forecasts based on the status of the crops, overcoming the expectations, with estimated averages of 3,800 to 4,000 kg/ha, minimums of 2,500 kg/ha and maximums of 5,500 kg/ha.
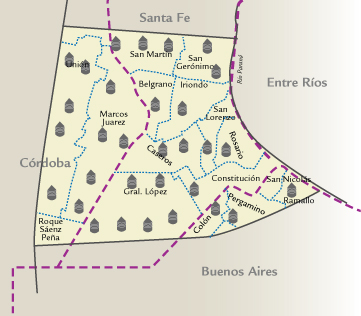
| MAP OF THE SUBREGION |
|
| |||||||||||||||||||||||||||||||||||||||||||||||||||||||||||||||||||||
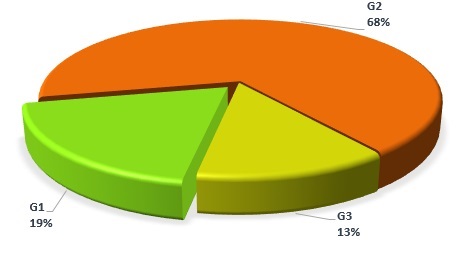
| GRADE DISTRIBUTION |
|
| FLOUR ANALYSIS | PARAMETERS | MINIMUM | MAXIMUM | AVERAGE | STANDARD DEVIATION | VARIATION COEFFICIENT | |||
| MILLING | Wet Gluten (%) | 21,0 | 29,6 | 26,5 | 1,8 | 6,80 | |||
| Dry Gluten (%) | 7,1 | 10,1 | 9,0 | 0,7 | 7,29 | ||||
| Falling Number (seg.) | 424 | 513 | 482 | 23 | 4,87 | ||||
| Flour Yield (%) | 70,8 | 74,8 | 73,1 | 1,1 | 1,49 | ||||
| Ash (dry basis) (%) | 0,571 | 0,765 | 0,650 | 0,050 | 7,65 | ||||
| FARINOGRAM | Water Absorption (14% H°) (%) | 54,7 | 61,1 | 56,8 | 1,3 | 2,36 | |||
| Development Time (min.) | 6,0 | 20,6 | 9,7 | 2,8 | 28,46 | ||||
| Stability (min.) | 10,8 | 35,2 | 18,6 | 4,5 | 24,36 | ||||
| Degree of Softening (12 min.) | 0 | 50 | 31 | 12 | 37,88 | ||||
| P (mm) | 68 | 115 | 88 | 12 | 13,81 | ||||
| ALVEOGRAMA | |||||||||
| L (mm) | 53 | 121 | 86 | 18 | 20,34 | ||||
| W Joules x 10-4 | 211 | 293 | 259 | 21 | 8,27 | ||||
| P / L | 0,60 | 2,13 | 1,02 | 0,39 | 35,38 | ||||
| These results were elaborated with 31 composite samples prepared proportionally from 432 primary samples (farmer deliveries) | |||||||||
SUBREGION DATA
In this sub region the wheat production was 1,809,960 tons., the 14% of the national total.
| APPENDIX OF LOCALITY COMPOSITE SAMPLES | |||||||||||||
| SAMPLE IDENTIFICATION | WHEAT ANALYSIS | ||||||||||||
| SAMPLE NUMBER | LOCALITY, DISTRICT OR DEPARTMENT | TONNAJE | GRADE | TEST WEIGT (Kg/hl) | TOTAL DAMAGED KERNELS(%) | FOREIGN MATERIAL (%) |
SHRUNKEN AND BROKEN KERNELS (%) | YELLOW BERRY KERNELS (%) |
PROTEIN(MOISTURE
s/b 13,5 % H°) |
PROTEIN (s/S.S.S.) |
WEIGT OF 1000 KERNELS (gr.) | ASH(dry basis) % | |
| 101 | San Martín | 4000 | 2 | 78,70 | 0,30 | 0,20 | 0,30 | 0,90 | 10,7 | 12,4 | 34,70 | 1,775 | |
| 102 | San Martín | 4000 | 2 | 76,10 | 0,70 | 0,20 | 0,10 | 0,70 | 10,9 | 12,6 | 32,20 | 1,825 | |
| 103 | San Martín | 4000 | 2 | 74,70 | 0,40 | 0,20 | 0,00 | 2,30 | 11,3 | 13,1 | 31,50 | 1,925 | |
| 104 | San Jerónimo | 4000 | 2 | 76,10 | 1,00 | 0,20 | 0,20 | 0,30 | 11,1 | 12,8 | 33,40 | 1,925 | |
| 105 | San Jerónimo | 4000 | 2 | 78,20 | 1,00 | 0,10 | 0,20 | 0,10 | 11,0 | 12,7 | 35,10 | 1,895 | |
| 106 | Caseros | 4000 | 2 | 76,60 | 0,30 | 0,20 | 0,50 | 0,70 | 11,3 | 13,1 | 32,00 | 1,855 | |
| 107 | Caseros | 4000 | 2 | 78,10 | 0,20 | 0,10 | 0,20 | 0,20 | 10,7 | 12,4 | 33,40 | 1,805 | |
| 108 | Belgrano | 4000 | 2 | 77,10 | 0,80 | 0,20 | 0,10 | 1,10 | 10,8 | 12,5 | 32,90 | 1,895 | |
| 109 | Iriondo | 4000 | 3 | 79,30 | 2,30 | 0,20 | 0,70 | 0,00 | 10,9 | 12,6 | 33,30 | 1,825 | |
| 110 | San Lorenzo | 4000 | 2 | 78,10 | 0,90 | 0,40 | 0,70 | 1,10 | 11,1 | 12,8 | 35,70 | 1,875 | |
| 111 |
| 4000 | 2 | 78,60 | 0,20 | 0,40 | 0,50 | 0,20 | 11,2 | 12,9 | 33,40 | 1,835 | |
| 112 |
| 4000 | 1 | 80,60 | 0,20 | 0,10 | 0,20 | 1,20 | 9,8 | 11,3 | 34,40 | 1,835 | |
| 113 |
| 4000 | 3 | 77,50 | 0,60 | 1,30 | 0,30 | 1,20 | 11,7 | 13,5 | 33,80 | 1,855 | |
| 114 |
| 4000 | 1 | 79,00 | 0,20 | 0,20 | 0,30 | 0,40 | 11,5 | 13,3 | 35,70 | 1,735 | |
| 115 |
| 4000 | 2 | 78,70 | 0,10 | 0,30 | 0,50 | 0,00 | 11,3 | 13,1 | 32,20 | 1,825 | |
| 116 |
| 4000 | 2 | 77,80 | 0,50 | 0,20 | 0,60 | 0,50 | 11,6 | 13,4 | 31,90 | 1,815 | |
| 117 |
| 4000 | 1 | 80,40 | 0,20 | 0,20 | 0,50 | 2,10 | 10,3 | 11,9 | 34,20 | 1,785 | |
| 118 |
| 4000 | 2 | 79,80 | 1,00 | 0,10 | 0,60 | 1,60 | 10,7 | 12,4 | 33,30 | 1,815 | |
| 119 |
| 4000 | 1 | 79,20 | 0,30 | 0,20 | 0,30 | 1,00 | 11,7 | 13,5 | 33,40 | 1,785 | |
| 120 |
| 4000 | 3 | 75,90 | 0,20 | 0,60 | 0,70 | 0,00 | 11,9 | 13,8 | 32,00 | 1,855 | |
| 121 |
| 4000 | 2 | 76,10 | 1,30 | 0,60 | 0,10 | 0,50 | 11,0 | 12,7 | 33,00 | 1,895 | |
| 122 |
| 4000 | 2 | 77,80 | 1,60 | 0,40 | 0,90 | 0,60 | 10,8 | 12,5 | 32,30 | 1,815 | |
| 123 |
| 4000 | 1 | 79,70 | 0,30 | 0,10 | 0,40 | 0,30 | 11,5 | 13,3 | 33,60 | 1,855 | |
| 124 |
| 4000 | 2 | 76,70 | 0,40 | 0,10 | 0,40 | 0,60 | 12,1 | 14,0 | 31,30 | 1,885 | |
| 125 |
| 4000 | 2 | 76,70 | 0,60 | 0,70 | 0,40 | 0,60 | 11,9 | 13,8 | 33,50 | 1,795 | |
| 126 |
| 4000 | 2 | 78,70 | 0,40 | 0,20 | 0,60 | 0,00 | 11,7 | 13,5 | 32,80 | 1,785 | |
| 127 |
| 4000 | 2 | 77,90 | 0,50 | 0,20 | 0,20 | 0,60 | 11,2 | 12,9 | 32,70 | 1,785 | |
| 128 |
| 4000 | 2 | 77,90 | 0,20 | 0,20 | 0,50 | 1,10 | 10,9 | 12,6 | 31,80 | 1,825 | |
| 129 |
| 4000 | 2 | 81,30 | 0,70 | 0,60 | 0,60 | 0,40 | 10,9 | 12,6 | 35,10 | 1,725 | |
| 130 |
| 4000 | 2 | 81,30 | 0,10 | 0,30 | 0,30 | 1,90 | 11,0 | 12,7 | 33,60 | 1,745 | |
| 131 |
| 4000 | 1 | 79,70 | 0,30 | 0,10 | 0,40 | 0,90 | 11,1 | 12,8 | 33,00 | 1,875 | |
| APPENDIX OF LOCALITY COMPOSITE SAMPLES | |||||||||||||||
| SAMPLE IDENTIFICATION | WHEAT ANALYSIS | ||||||||||||||
| SAMPLE NUMBER |
LOCALITY, DISTRICT OR DEPARTMENT | WET GLUTEN(%) | DRY GLUTEN(%) | FALLING NUMBER (SEG,) | FLOUR YIELD(%) | FARINOGRAM | ALVEOGRAM | ASH(dry basis)(%) | |||||||
| % AA (14 % H°) | T, D, (MIN.) | STABILITY (MIN.) | DEGREE SOFTENING(12 MIN.) | P | L | W | P/L | ||||||||
| 101 | San Martín | 24,8 | 8,2 | 474 | 73,4 | 57,0 | 11,9 | 22,2 | 28 | 102 | 70 | 262 | 1,46 | 0,655 | |
| 102 | San Martín | 25,9 | 8,8 | 465 | 73,1 | 57,9 | 12,2 | 23,1 | 28 | 103 | 80 | 293 | 1,29 | 0,625 | |
| 103 | San Martín | 25,6 | 8,7 | 471 | 73,6 | 55,7 | 12,1 | 22,7 | 28 | 83 | 90 | 262 | 0,92 | 0,585 | |
| 104 | San Jerónimo | 26,2 | 8,9 | 459 | 72,6 | 56,5 | 12,1 | 21,8 | 30 | 94 | 77 | 262 | 1,22 | 0,625 | |
| 105 | San Martín | 27,3 | 8,8 | 470 | 72,2 | 61,1 | 6,6 | 10,8 | 47 | 97 | 66 | 218 | ,147 | 0,705 | |
| 106 | Caseros | 27,7 | 9,4 | 449 | 71,6 | 55,6 | 11,9 | 20,9 | 32 | 78 | 98 | 265 | 0,80 | 0,585 | |
| 107 | Caseros | 24,8 | 8,5 | 440 | 71,4 | 58,6 | 10,2 | 18,9 | 26 | 103 | 54 | 222 | 1,91 | 0,615 | |
| 108 | Belgrano | 24,8 | 8,3 | 450 | 72,3 | 57,3 | 11,9 | 20,1 | 26 | 86 | 88 | 264 | 0,98 | 0,585 | |
| 109 | Iriondo | 26,3 | 8,6 | 456 | 71,5 | 60,2 | 9,6 | 17,8 | 24 | 115 | 61 | 264 | 1,89 | 0,655 | |
| 110 | San Lorenzo | 26,6 | 8,8 | 424 | 70,8 | 57,4 | 9,6 | 21,5 | 20 | 97 | 80 | 278 | 1,21 | 0,571 | |
| 111 |
| 21,0 | 7,1 | 457 | 72,5 | 56,0 | 20,6 | 35,2 | 13 | 113 | 53 | 246 | 2,13 | 0,585 | |
| 112 |
| 27,7 | 9,3 | 509 | 71,4 | 56,1 | 8,7 | 16,4 | 0 | 76 | 94 | 242 | 0,81 | 0,655 | |
| 113 |
| 28,8 | 9,6 | 507 | 73,9 | 57,7 | 7,3 | 14,5 | 44 | 82 | 94 | 258 | 0,87 | 0,695 | |
| 114 |
| 27,9 | 9,5 | 509 | 73,9 | 57,7 | 7,3 | 14,5 | 44 | 82 | 94 | 258 | 0,87 | 0,695 | |
| 115 |
| 28,6 | 9,7 | 489 | 74,3 | 57,0 | 6,3 | 18,1 | 32 | 80 | 84 | 237 | 0,95 | 0,665 | |
| 116 |
| 27,2 | 9,6 | 505 | 74,1 | 55,4 | 7,8 | 18,5 | 35 | 78 | 92 | 250 | 0,85 | 0,605 | |
| 117 |
| 23,4 | 7,8 | 483 | 74,8 | 555,4 | 9,7 | 18,1 | 39 | 87 | 69 | 211 | 0,87 | 0,695 | |
| 118 |
| 25,3 | 8,3 | 484 | 74,1 | 56,7 | 9,4 | 16,2 | 40 | 92 | 73 | 238 | 1,26 | 0,655 | |
| 119 |
| 28,7 | 9,8 | 490 | 73,0 | 55,7 | 6,1 | 18,2 | 32 | 72 | 121 | 280 | 0,60 | 0,645 | |
| 120 |
| 29,6 | 10,1 | 479 | 73,2 | 56,5 | 6,0 | 15,1 | 41 | 75 | 120 | 290 | 0,63 | 0,705 | |
| 121 |
| 25,2 | 8,9 | 463 | 74,0 | 54,7 | 8,3 | 15,0 | 44 | 68 | 111 | 240 | 0,61 | 0,625 | |
| 122 |
| 25,5 | 8,7 | 496 | 71,5 | 56,2 | 8,1 | 13,5 | 46 | 76 | 98 | 243 | 0,78 | 0,685 | |
| 123 |
| 26,6 | 9,3 | 512 | 73,1 | 56,5 | 13,2 | 27,2 | 21 | 90 | 83 | 280 | 1,08 | 0,635 | |
| 124 |
| 28,7 | 10,0 | 490 | 73,3 | 55,9 | 9,6 | 20,0 | 32 | 76 | 114 | 290 | 0,67 | 0,705 | |
| 125 |
| 28,0 | 9,9 | 487 | 72,7 | 55,6 | 9,4 | 16,2 | 34 | 74 | 112 | 271 | 0,66 | 0,615 | |
| 126 |
| 29,1 | 9,6 | 513 | 74,6 | 57,7 | 8,3 | 15,2 | 37 | 78 | 102 | 268 | 0,76 | 0,685 | |
| 127 |
| 25,6 | 9,0 | 484 | 74,7 | 56,6 | 7,9 | 13,4 | 50 | 80 | 89 | 239 | 0,90 | 0,735 | |
| 128 |
| 25,6 | 8,9 | 497 | 72,8 | 55,8 | 8,2 | 13,9 | 47 | 80 | 88 | 247 | 0,91 | 0,625 | |
| 129 |
| 26,6 | 9,1 | 509 | 72,7 | 57,8 | 10,5 | 18,3 | 28 | 98 | 71 | 256 | 1,38 | 0,635 | |
| 130 |
| 25,9 | 8,9 | 512 | 74,5 | 57,3 | 9,2 | 17,3 | 37 | 98 | 79 | 284 | 1,24 | 0,755 | |
| 131 |
| 25,7 | 8,7 | 499 | 74,0 | 56,6 | 10,4 | 19,3 | 32 | 99 | 78 | 285 | 1,27 | 0,655 | |