


 SUBREGION V NORTH
The sown surface was 15 % less than the campaign 2010/11, due mainly to the lack of proper humidity in the soil profile. The sowing was done between May and June. Due to the lack of soil water, in some zones, there was irregular emergence, plants with low height and tillering, which led the producers to destine them to animal feed.
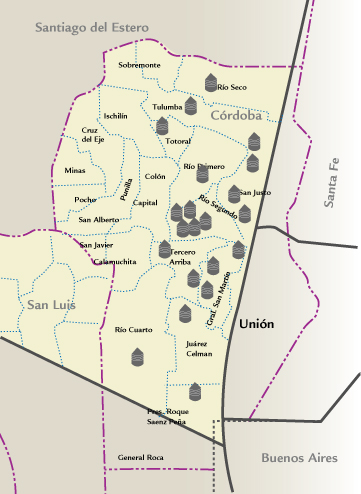
The strong frosts occurred at the beginning of July stopped the growth and there were fields with yellow tips. The Department of Santa María was the most affected one due to the lack of humidity, followed by the Department of Río Segundo. The stem elongation stage to the earing stage was irregular since there were late frosts affecting the grain filling. High temperatures and intense solar exposure caused the speeding up of the crop and decreased the production.
Furthermore, during the last stage of the cycle, there were strong storms, with strong winds and hail, producing in some cases significant decreases in the yields.
In relation to the presence of plagues during the crop cycle, there were some aphids, mites and diseases such as leaf rust, yellow spot, Septoria, Fusarium and “common bunt” (Tilletia).
The yields of rainfed wheat were around 2,000 kg/ha and in the fields with irrigation between 3,000 to 4,500 kg/ha.
There were zones with good gluten and proteins, and others where there were “washed”, and shrunken grains, presence of Fusarium and low gluten.
| MAP OF THE SUBREGION |
|
| ||||||||||||||||||||||||||||||||||||||||||||||||||||||||||||||||||||||
| GRADE DISTRIBUTION |
|
| FLOUR ANALYSIS | PARAMETERS | MINIMUM | MAXIMUM | AVERAGE | STANDARD DEVIATION | VARIATION COEFFICIENT | |||
| MILLING | Wet Gluten (%) | 18,6 | 29,6 | 24,5 | 3,0 | 12,04 | |||
| Dry Gluten (%) | 6,0 | 9,8 | 8,2 | 0,9 | 11,05 | ||||
| Falling Number (seg.) | 343 | 452 | 391 | 32 | 8,16 | ||||
| Flour Yield(%) | 71,4 | 74,0 | 72,2 | 0,7 | 0,95 | ||||
| Ash (dry basis) (%) | 0,603 | 0,749 | 0,673 | 0,041 | 6,10 | ||||
| FARINOGRAM | Water Absorption(14 % H°) (%) | 54,8 | 61,1 | 57,3 | 1,5 | 2,68 | |||
| Development Time (min.) | 1,6 | 19,2 | 10,8 | 4,5 | 41,61 | ||||
| Stability (min.) | 1,2 | 29,9 | 20,4 | 7,7 | 37,85 | ||||
| Degree of Softening (12 min.) | 10 | 49 | 27 | 10 | 36,65 | ||||
| P (mm) | 76 | 120 | 93 | 12 | 12,62 | ||||
| ALVEOGRAM | |||||||||
| L (mm) | 37 | 98 | 77 | 18 | 23,46 | ||||
| W Joules x 10-4 | 193 | 325 | 262 | 41 | 15,54 | ||||
| P / L | 0,80 | 3,24 | 1,34 | 0,61 | 45,16 | ||||
| These results were elaborated with 14 composite samples prepared proportionally from 100 primary samples (farmer deliveries). | |||||||||
SUBREGION DATA
In this sub region the wheat production was 711,080 tons., the 5.5% of the national total. Were sampled 62,309 tons., the 8.8% of the sub region production.
| APPENDIX OF LOCALITY COMPOSITE SAMPLES | |||||||||||||
| SAMPLE IDENTIFICATION | WHEAT ANALYSIS | ||||||||||||
| SAMPLE NUMBER | LOCALITY, DISTRICT OR DEPARTMENT | TONNAJE | GRADE | TEST WEIGT (Kg/hl) | TOTAL DAMAGED KERNELS(%) | FOREIGN MATERIAL (%) |
SHRUNKEN AND BROKEN KERNELS (%) | YELLOW BERRY KERNELS(%) | PROTEIN (MOISTURE 13,5 % H°) |
PROTEIN (s/S.S.S.) | WEIGT OF 1000 KERNELS | ASH(dry basis)(%) | |
| 600 | San Justo | 3878 | 2 | 79,25 | 1,42 | 0,37 | 0,63 | 0,30 | 10,8 | 12,5 | 31,03 | 1,910 | |
| 601 | San Justo | 4238 | 2 | 78,35 | 0,28 | 0,06 | 1,20 | 0,00 | 13,2 | 11,2 | 26,40 | 2,097 | |
| 602 | Gral. San Martín | 4000 | 2 | 78,80 | 1,16 | 0,25 | 0,73 | 0,40 | 12,1 | 14,0 | 32,54 | 1,910 | |
| 603 | Gral. San Martín | 4800 | 2 | 79,45 | 0,98 | 0,21 | 0,75 | 1,10 | 11,1 | 12,8 | 30,53 | 2,000 | |
| 604 | Gral. San Martín | 3600 | 2 | 78,60 | 1,10 | 0,20 | 0,47 | 0,70 | 10,8 | 12,5 | 32,52 | 1,850 | |
| 605 | Río Segundo | 4000 | 2 | 78,35 | 1,23 | 0,26 | 0,66 | 0,90 | 11,3 | 13,1 | 31,67 | 2,110 | |
| 606 | Río Segundo | 3832 | 2 | 78,60 | 0,86 | 0,15 | 0,51 | 2,30 | 9,0 | 10,4 | 31,66 | 1,790 | |
| 607 | Río Segundo | 3766 | 2 | 78,60 | 0,97 | 0,18 | 0,62 | 3,20 | 10,0 | 11,6 | 31,75 | 1,790 | |
| 608 | Río Segundo | 6000 | 2 | 77,00 | 1,02 | 0,20 | 0,46 | 1,20 | 10,6 | 12,3 | 31,14 | 1,840 | |
| 609 | Río Segundo | 3700 | 2 | 77,60 | 1,60 | 0,15 | 0,46 | 2,20 | 10,2 | 11,8 | 30,95 | 1,900 | |
| 610 |
| 7500 | 2 | 77,45 | 1,01 | 0,18 | 0,68 | 0,60 | 11,1 | 12,8 | 31,52 | 1,990 | |
| 611 |
| 4000 | 2 | 77,70 | 0,58 | 0,12 | 0,62 | 0,90 | 12,4 | 14,3 | 30,29 | 1,930 | |
| 612 |
| 4000 | 2 | 81,05 | 0,64 | 0,30 | 0,45 | 1,10 | 12,0 | 13,9 | 32,22 | 1,820 | |
| 613 |
| 5000 | 2 | 79,90 | 0,63 | 0,21 | 1,10 | 1,20 | 11,6 | 13,4 | 32,14 | 1,820 | |
| APPENDIX OF LOCALITY COMPOSITE SAMPLES | |||||||||||||||
| SAMPLE IDENTIFICATION | FLOUR ANALYSIS | ||||||||||||||
| SAMPLE NUMBER | LOCALITY, DISTRICT OR DEPARTMENT | WET GLUTEN (%) | DRY GLUTEN(%) | FALLING NUMBER (SEG,) | FLOUR YIELD(%) | FARINOGRAM | ALVEOGRAM | ASH(dry basis)(%) | |||||||
| % AA (14 % H°) | T, D, (MIN,) | STABILITY (MIN,) | DEGREE SOFTENING(12 MIN,) | P | L | W | P/L | ||||||||
| 600 | San Justo | 24,3 | 8,1 | 420 | 74,0 | 57,1 | 2,2 | 8,8 | 49 | 84 | 69 | 214 | 1,22 | 0,749 | |
| 601 | San Justo | 22,7 | 8,0 | 392 | 72,1 | 54,8 | 10,0 | 19,8 | 29 | 76 | 65 | 193 | 1,17 | 0,650 | |
| 602 | Gral. San Martín | 27,5 | 9,0 | 377 | 71,6 | 58,5 | 9,8 | 13,8 | 34 | 93 | 89 | 292 | 1,04 | 0,695 | |
| 603 | Gral. San Martín | 25,5 | 8,4 | 360 | 72,5 | 56,6 | 8,7 | 17,4 | 34 | 78 | 98 | 253 | 0,80 | 0,690 | |
| 604 | Gral. San Martín | 24,3 | 8,2 | 386 | 72,5 | 57,9 | 8,9 | 15,9 | 36 | 78 | 92 | 247 | 0,85 | 0,715 | |
| 605 | Río Segundo | 24,4 | 7,9 | 383 | 71,5 | 570 | 12,9 | 21,6 | 26 | 93 | 79 | 282 | 1,18 | 0,634 | |
| 606 | Río Segundo | 18,6 | 6,0 | 388 | 72,6 | 58,9 | 1,6 | 1,2 | 10 | 120 | 37 | 194 | 3,24 | 0,653 | |
| 607 | Río Segundo | 22,4 | 7,6 | 405 | 71,4 | 56,1 | 14,6 | 26,3 | 18 | 107 | 58 | 254 | 1,84 | 0,657 | |
| 608 | Río Segundo | 22,1 | 7,6 | 413 | 72,9 | 56,2 | 13,2 | 28,0 | 17 | 106 | 56 | 232 | 1,89 | 0,701 | |
| 609 | Río Segundo | 21,2 | 7,2 | 360 | 72,8 | 55,9 | 19,2 | 29,1 | 21 | 103 | 57 | 247 | 1,81 | 0,610 | |
| 610 | Tercero Arriba | 23,8 | 8,1 | 343 | 71,4 | 57,0 | 16,0 | 29,9 | 18 | 90 | 93 | 325 | 0,97 | 0,639 | |
| 611 | Sáenz Peña | 29,6 | 9,8 | 376 | 72,1 | 58,7 | 10,5 | 19,4 | 31 | 92 | 79 | 279 | 1,16 | 0,706 | |
| 612 | Juárez Celman | 27,0 | 9,1 | 442 | 71,7 | 56,9 | 11,8 | 24,1 | 25 | 88 | 92 | 295 | 0,96 | 0,603 | |
| 613 | Río Cuarto | 29,6 | 9,5 | 452 | 72,0 | 61,1 | 7,9 | 15,0 | 39 | 91 | 93 | 302 | 0,98 | 0,718 | |