


 SUBREGION V NORTH
The sown surface was significantly broader than that of 2009/2010 campaign mainly due to a better supply and accumulation of soil water, but the uncertainty as regards commercialization lead the producers, in some cases, to sow smaller surfaces and others not to sow.
The sow was mainly done during May, but there were some specific zones where the sow was done by the end of April.
Although, in general, there were no major problems, in some areas there was a slow growing and leaf spotting due to the lack of soil humidity, and there were lots with small plants, plants lots and lots where the future expectations lead the producers to destine the plants to animal consumption.
The growing stages were irregular, since there were late frosts that affected in different proportions the grain filling.
The sanitary status of the crops was good in general, except for some specific cases of yellow spot and leaf rust. As regards the occurrence of plagues during the crops development, there were aphids and some mites.
At the grain filling stage, in some lots, the crops were snatched, which damaged the grains in the superior part of the ear, due to the presence of high temperatures.
The Department that outstood due to its high performance was General San Martín, with average values higher than 3000 kg/ha. Such high levels were also registered in the departments of San Justo, Río Primero, Río Segundo and Roque Sáenz Peña. The lots form the dry lands had performances of around 1000 and 3000 kg/ha. The lots with irrigation had performances of between 3000 and 5000 kg/ha. Such high performances influenced the lower percentages of proteins and gluten.
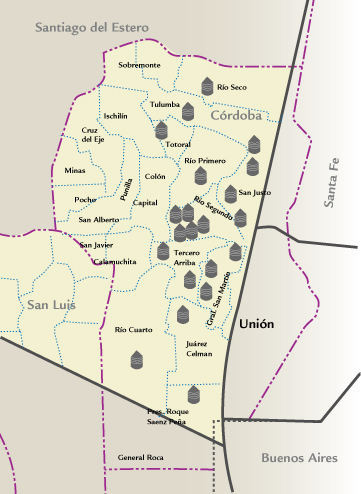
| MAP OF THE SUBREGION |
|
| ||||||||||||||||||||||||||||||||||||||||||||||||||||||||||||||||||||||
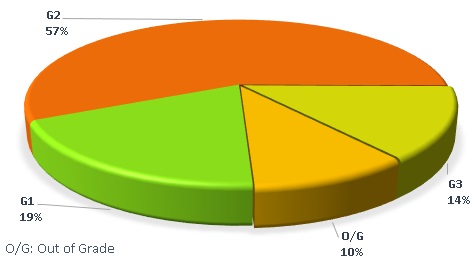
| GRADE DISTRIBUTION |
|
| FLOUR ANALYSIS | PARAMETERS | MINIMUM | MAXIMUM | AVERAGE | STANDARD DEVIATION | VARIATION COEFFICIENT | |||
| MILLING | Wet Gluten (%)) | 17,7 | 29,7 | 23,5 | 3,0 | 12,73 | |||
| Dry Gluten (%) | 6,2 | 9,9 | 8,0 | 1,0 | 12,02 | ||||
| Falling Number (seg.) | 328 | 505 | 389 | 39 | 9,93 | ||||
| Flour Yield(%) | 58,9 | 72,2 | 63,1 | 3,3 | 5,23 | ||||
| Ash (dry basis) (%) | 0,482 | 0,600 | 0,536 | 0,024 | 4,57 | ||||
| FARINOGRAM | Water Absorption(14 % H°) (%) | 55,1 | 60,9 | 57,6 | 1,5 | 2,63 | |||
| Development Time (min.) | 6,5 | 37,9 | 20,5 | 10,1 | 49,11 | ||||
| Stability (min,) | 5,4 | 52,2 | 29,5 | 13,5 | 45,69 | ||||
| Degree of Softening (12 min.) | 5 | 68 | 21 | 13 | 63,42 | ||||
| P (mm) | 80 | 115 | 99 | 9 | 9,48 | ||||
| ALVEOGRAM | |||||||||
| L (mm) | 46 | 90 | 69 | 9 | 13,22 | ||||
| W Joules x 10-4 | 164 | 320 | 262 | 41 | 15,57 | ||||
| P / L | 0,98 | 2,07 | 1,44 | 0,23 | 15,87 | ||||
| These results were elaborated with 21 composite samples prepared proportionally from 149 primary samples (farmer deliveries). | |||||||||
SUBREGION DATA
In this sub region the wheat production was 927,840 tons., the 6.4% of the national total. Were sampled 95,777 tons., the 10.3% of the sub region production.
| APPENDIX OF LOCALITY COMPOSITE SAMPLES | |||||||||||||
| SAMPLE IDENTIFICATION | WHEAT ANALYSIS | ||||||||||||
| SAMPLE NUMBER | LOCALITY, DISTRICT OR DEPARTMENT | TONNAJE | GRADE | TEST WEIGT (Kg/hl) | TOTAL DAMAGED KERNELS(%) | FOREIGN MATERIAL (%) |
SHRUNKEN AND BROKEN KERNELS
(%) | YELLOW BERRY KERNELS(%) | PROTEIN (MOISTURE 13,5 % H°) |
PROTEIN (s/S.S.S.) | WEIGT OF 1000 KERNELS | ASH(dry basis)(%) | |
| 600 | San Justo | 4230 | 2 | 79,70 | 0,43 | 0,07 | 0,54 | 2,10 | 10,4 | 12,0 | 32,72 | 1,900 | |
| 601 | San Justo | 4027 | 2 | 80,35 | 0,58 | 0,10 | 0,60 | 3,50 | 10,3 | 11,9 | 32,22 | 1,820 | |
| 602 | San Justo | 4000 | 2 | 80,60 | 0,72 | 0,21 | 0,69 | 0,50 | 11,5 | 13,3 | 34,37 | 1,870 | |
| 603 | San Justo | 4000 | 2 | 80,35 | 0,46 | 0,19 | 0,77 | 1,70 | 10,9 | 12,6 | 34,76 | 1,880 | |
| 604 | Río Segundo | 4000 | F/E | 81,50 | 0,83 | 0,52 | 2,05 | 0,40 | 12,2 | 14,1 | 32,09 | 1,890 | |
| 605 | Río Segundo | 4400 | 3 | 79,25 | 0,40 | 0,16 | 1,58 | 0,30 | 11,4 | 13,2 | 32,54 | 1,880 | |
| 606 | Río Segundo | 6300 | 2 | 78,80 | 0,47 | 0,43 | 0,96 | 3,30 | 10,2 | 11,8 | 31,68 | 1,840 | |
| 607 | Río Segundo | 5000 | 2 | 79,25 | 0,32 | 0,19 | 1,00 | 1,50 | 10,6 | 12,3 | 33,11 | 1,620 | |
| 608 | Río Segundo | 5400 | 2 | 79,70 | 0,45 | 0,28 | 0,61 | 2,50 | 10,2 | 11,8 | 33,06 | 1,840 | |
| 609 | Juárez Celman | 6690 | 3 | 77,90 | 0,53 | 0,18 | 1,29 | 0,10 | 11,9 | 13,8 | 32,40 | 1,600 | |
| 610 |
| 4000 | 2 | 80,35 | 0,46 | 0,11 | 0,89 | 1,10 | 10,3 | 11,9 | 35,46 | 1,770 | |
| 611 |
| 2030 | 2 | 78,35 | 0,40 | 0,16 | 1,04 | 0,40 | 11,6 | 13,4 | 31,50 | 1,870 | |
| 612 |
| 4400 | 2 | 77,90 | 072 | 0,16 | 0,92 | 0,80 | 11,5 | 13,3 | 32,59 | 1,690 | |
| 613 |
| 3800 | F/E | 77,90 | 0,56 | 0,24 | 2,30 | 0,80 | 11,4 | 13,2 | 30,93 | 1,800 | |
| 614 |
| 2400 | 3 | 78,35 | 0,40 | 0,14 | 1,45 | 0,60 | 11,4 | 13,2 | 30,93 | 1,780 | |
| 615 |
| 4200 | 1 | 82,15 | 0,32 | 0,08 | 0,45 | 2,00 | 10,9 | 12,6 | 34,88 | 1,680 | |
| 616 |
| 3000 | 1 | 82,15 | 0,90 | 0,19 | 0,30 | 2,00 | 11,6 | 13,4 | 34,93 | 1,720 | |
| 617 |
| 3000 | 1 | 83,05 | 0,26 | 0,05 | 0,23 | 4,10 | 10,4 | 12,0 | 35,72 | 1,640 | |
| 618 |
| 3000 | 1 | 82,85 | 0,11 | 0,07 | 0,12 | 3,50 | 9,2 | 10,6 | 34,92 | 1,650 | |
| 619 |
| 3000 | 2 | 82,35 | 0,64 | 0,24 | 0,32 | 1,10 | 10.3 | 11,4 | 34,43 | 1,750 | |
| 620 |
| 9900 | 2 | 77,25 | 0,42 | 0,10 | 1,07 | 0,10 | 12,3 | 14,2 | 29,42 | 1,760 | |
| APPENDIX OF LOCALITY COMPOSITE SAMPLES | |||||||||||||||
| SAMPLE IDENTIFICATION | FLOUR ANALYSIS | ||||||||||||||
| SAMPLE NUMBER | LOCALITY, DISTRICT OR DEPARTMENT | WET GLUTEN (%) | DRY GLUTEN(%) | FALLING NUMBER (SEG.) | FLOUR YIELD(%) | FARINOGRAM | ALVEOGRAM | ASH(dry basis)(%) | |||||||
| % AA (14 % H°) | T, D, (MIN.) | STABILITY (MIN.) | DEGREE SOFTENING(12 MIN.) | P | L | W | P/L | ||||||||
| 600 | San Justo | 18,8 | 6,4 | 371 | 64,4 | 55,3 | 15,9 | 29,0 | 14 | 98 | 67 | 250 | 1,46 | 0,515 | |
| 601 | San Justo | 20,0 | 7,1 | 369 | 64,2 | 55,1 | 13,4 | 27,3 | 12 | 90 | 60 | 210 | 1,50 | 0,533 | |
| 602 | San Justo | 23,4 | 7,9 | 395 | 62,2 | 58,8 | 13,2 | 31,7 | 13 | 109 | 67 | 287 | 1,63 | 0,533 | |
| 603 | San Justo | 20,8 | 7,4 | 356 | 62,1 | 56,4 | 11,8 | 2,15 | 20 | 81 | 83 | 238 | 0,98 | 0,539 | |
| 604 | Río Segundo | 26,4 | 8,8 | 505 | 58,9 | 59,9 | 10,7 | 28,9 | 12 | 105 | 72 | 281 | 1,46 | 0,541 | |
| 605 | Río Segundo | 25,7 | 8,6 | 371 | 59,6 | 60,9 | 29,9 | 28,6 | 21 | 111 | 75 | 309 | 1,48 | 0,537 | |
| 606 | Río Segundo | 21,5 | 7,3 | 351 | 60,8 | 56,1 | 30,8 | 46,7 | 10 | 93 | 66 | 239 | 1,41 | 0,527 | |
| 607 | Río Segundo | 19,2 | 6,5 | 370 | 60,3 | 56,6 | 27,4 | 37,4 | 13 | 95 | 46 | 187 | 2,07 | 0,545 | |
| 608 | Río Segundo | 20,5 | 7,3 | 359 | 64,9 | 57,2 | 34,0 | 40,7 | 20 | 102 | 65 | 264 | 1,57 | 0,572 | |
| 609 | Juárez Celman | 26,3 | 9,1 | 351 | 63,4 | 58,9 | 18,0 | 9,5 | 23 | 114 | 75 | 320 | 1,52 | 0,482 | |
| 610 | Tercero Arriba | 17,7 | 6,2 | 379 | 63,7 | 56,9 | 34,3 | 52,2 | 10 | 103 | 64 | 262 | 1,61 | 0,538 | |
| 611 | Tercero Arriba | 25,0 | 8,5 | 384 | 60,6 | 59,2 | 37,1 | 52,1 | 5 | 106 | 61 | 264 | 1,74 | 0,541 | |
| 612 | Gral. San Martín | 24,4 | 8,2 | 416 | 59,3 | 56,9 | 29,6 | 42,8 | 12 | 95 | 90 | 309 | 1,06 | 0,524 | |
| 613 | Gral. San Martín | 24,1 | 8,1 | 419 | 60,1 | 56,3 | 37,9 | 47,2 | 18 | 97 | 67 | 262 | 1,45 | 0,521 | |
| 614 | Gral. San Martín | 25,2 | 8,6 | 385 | 63,3 | 59,1 | 33,3 | 41,0 | 19 | 115 | 60 | 280 | 1,92 | 0,576 | |
| 615 | Pte. Roque Sáenz Peña | 25,7 | 8,7 | 390 | 64,9 | 57,4 | 16,8 | 28,3 | 20 | 100 | 67 | 265 | 1,49 | 0,600 | |
| 616 | Totoral | 29,7 | 9,9 | 392 | 62,0 | 60,5 | 6,5 | 5,4 | 68 | 89 | 78 | 245 | 1,14 | 0,532 | |
| 617 | Río Seco | 24,9 | 8,3 | 350 | 61,1 | 58,7 | 7,4 | 9,2 | 45 | 95 | 61 | 209 | 1,56 | 0,545 | |
| 618 | Tulumba | 22,4 | 7,2 | 328 | 63,7 | 57,9 | 6,9 | 9,2 | 51 | 80 | 56 | 164 | 1,43 | 0,523 | |
| 619 | Río Primero | 23,7 | 8,1 | 421 | 72,2 | 56,6 | 8,8 | 13,7 | 33 | 88 | 71 | 239 | 1,24 | 0,556 | |
| 620 | Río Cuarto | 26,9 | 9,2 | 438 | 63,6 | 58,1 | 16,5 | 29,9 | 15 | 106 | 73 | 312 | 1,45 | 0,525 | |