


 SUBREGION I
The sowing started between the end of May and the beginning of June, with good humidity conditions in the soil. These conditions assured a good emergence and stand of the plants, with a good initial growing of the crops.
In the months of July and August, the lack of rains and the low temperatures, and the occurrence of numerous frosts, stopped the growing, particularly of the short cycles sown latter, although the minor requirements of humidity at the first stages of growing did not affect significantly the wheat.
In the first days of September, there were beneficial rains at the beginning of the stem elongation, which repeated during the second half of that month, allowing a good evolution of the crops. The continuity of the rains during the period of October-November resulted very beneficial for the grain filling, and that was reflected in the high performances and in the good hectoliter weight of the harvested grains. The quality of the grains was very good, although the level of proteins in many cases was below the basis level.
The sanitary status in general was good during the cycle, although it is worth mentioning that in some zones, there was a slight affection of yellow spot and rust in lots with susceptible varieties.
The performance varied between 1500 and 5000 kg/ha, with average per location varying between 3000 and 3500 kg/ha, and many llots stood out with maximum productivities of between 4000 and 5000 kg/ha.
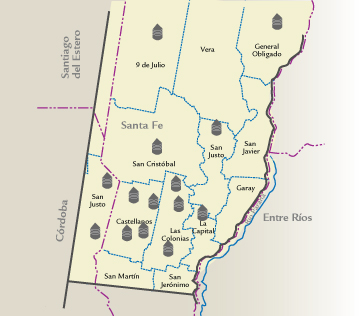
| MAP OF THE SUBREGION |
|
| ||||||||||||||||||||||||||||||||||||||||||||||||||||||||||||||||||||||
| GRADE DISTRIBUTION |
|
| FLOUR ANALYSIS | PARAMETERS | MINIMUM | MAXIMUM | AVERAGE | STANDARD DEVIATION | VARIATION COEFFICIENT | |||
| MILLING | Wet Gluten (%) | 18,3 | 28,8 | 24,6 | 3,4 | 13,91 | |||
| Dry Gluten (%) | 6,4 | 9,7 | 8,3 | 1,0 | 12,29 | ||||
| Falling Number (sec.) | 300 | 449 | 402 | 40 | 9,89 | ||||
| Flour Yield(%) | 55,3 | 65,5 | 61,5 | 2,8 | 4,51 | ||||
| Ash (dry basis) (%) | 0,501 | 0,594 | 0,559 | 0,025 | 4,55 | ||||
| FARINOGRAM | Water Absorption(14 % H°) (%) | 57,0 | 60,2 | 58,8 | 1,1 | 1,81 | |||
| Development Time (min.) | 9,6 | 22,1 | 14,4 | 3,7 | 25,68 | ||||
| Stability (min.) | 15,6 | 38,1 | 28,3 | 7,9 | 28,02 | ||||
| Degree of Softening (12 min.) | 11 | 42 | 22 | 9 | 42,39 | ||||
| P (mm) | 86 | 129 | 107 | 13 | 11,83 | ||||
| ALVEOGRAM | |||||||||
| L (mm) | 47 | 92 | 76 | 14 | 18,18 | ||||
| W Joules x 10-4 | 230 | 382 | 308 | 38 | 12,49 | ||||
| P / L | 0,97 | 2,53 | 1,41 | 0,45 | 30,45 | ||||
| These results were elaborated with 14 composite samples prepared proportionally from 305 primary samples (farmer deliveries). | |||||||||
SUBREGION DATA
In this sub region the wheat production was 829,150 tons., the 5.7% of the national total. Were sampled 51,800 tons., the 6,3% of the sub region production
| APPENDIX OF LOCALITY COMPOSITE SAMPLES | |||||||||||||
| SAMPLE IDENTIFICATION | WHEAT ANALYSIS | ||||||||||||
| SAMPLE NUMBER | LOCALITY, DISTRICT OR DEPARTMENT | TONNAJE | GRADE | TEST WEIGT (Kg/hl) | TOTAL DAMAGED KERNELS(%) | FOREIGN MATERIAL (%) |
SHRUNKEN AND BROKEN KERNELS
(%) | YELLOW BERRY KERNELS(%) | PROTEIN (MOISTURE 13,5 % H°) |
PROTEIN (s/S.S.S.) | WEIGT OF 1000 KERNELS | ASH(dry basis)(%) | |
| 1 | Gral. Obligado | 3480 | 2 | 83,10 | 0,34 | 0,04 | 0,94 | 14,10 | 9,4 | 10,9 | 33,70 | 1,933 | |
| 2 | 9 de Julio | 3850 | 2 | 83,30 | 0,30 | 0,08 | 0,96 | 10,42 | 10,0 | 11,6 | 31,50 | 1,602 | |
| 3 | Castellanos | 3720 | 2 | 8170 | 0,26 | 0,10 | 0,74 | 1,60 | 11,0 | 12,7 | 33,80 | 1,713 | |
| 4 | Castellanos | 4110 | 3 | 79,90 | 0,28 | 0,06 | 1,00 | --- | 11,9 | 13,8 | 32,50 | 1,608 | |
| 5 | Castellanos | 3950 | 2 | 80,00 | 0,28 | 0,06 | 1,06 | --- | 11,3 | 13,1 | 29,60 | 1,944 | |
| 6 | Castellanos | 4070 | 2 | 81,90 | 0,24 | 0,16 | 1,14 | 2,00 | 11,2 | 12,9 | 32,50 | 1,793 | |
| 7 | Las Capital | 4070 | 2 | 81,30 | 0,36 | 0,14 | 0,92 | 10,20 | 9,5 | 11,1 | 35,70 | 1,659 | |
| 8 | Las Colonias | 4210 | 2 | 83,20 | 0,22 | 0,26 | 0,72 | 5,36 | 10,4 | 12,0 | 33,10 | 1,781 | |
| 9 | Las Colonias | 3970 | 2 | 79,60 | 0,36 | 0,12 | 1,02 | 4,10 | 11,0 | 12,7 | 32,90 | 1,762 | |
| 10 | Las Colonias | 2200 | 2 | 81,10 | 0,46 | 0,12 | 0,60 | 7,50 | 10,5 | 12,1 | 33,40 | 1,705 | |
| 11 |
| 1780 | 2 | 82,90 | 0,22 | 0,10 | 1,00 | 11,90 | 9,8 | 11,3 | 36,70 | 1,630 | |
| 12 |
| 4060 | 2 | 83,00 | 0,28 | 0,14 | 0,86 | 6,60 | 10,1 | 11,7 | 37,90 | 1,548 | |
| 13 |
| 3750 | 2 | 82,10 | 0,70 | 0,24 | 0,60 | 13,50 | 9,9 | 11,4 | 36,90 | 1,727 | |
| 14 |
| 5950 | 2 | 82,30 | 0,54 | 0,16 | 1,20 | 4,90 | 11,6 | 13,4 | 31,7 | 1,796 | |
| APPENDIX OF LOCALITY COMPOSITE SAMPLES | |||||||||||||||
| SAMPLE IDENTIFICATION | WHEAT ANALYSIS | ||||||||||||||
| SAMPLE NUMBER | LOCALITY, DISTRICT OR DEPARTMENT | WET GLUTEN (%) | DRY GLUTEN(%) | FALLING NUMBER (sec.) | FLOUR YIELD(%) | FARINOGRAM | ALVEOGRAM | ASH(dry basis)(%) | |||||||
| % WA (14 % H°) | D. T. (min.) | STABILITY (min.) | DEGREE SOFTENING(12 min.) | P | L | W | P/L | ||||||||
| 1 | Gral. Obligado | 18,3 | 6,4 | 300 | 62,4 | 57,6 | 16,5 | 32,2 | 12 | 119 | 47 | 230 | 2,53 | 0,501 | |
| 2 | 9 de Julio | 20,3 | 7,10 | 394 | 64,7 | 58,9 | 18,0 | 26,7 | 23 | 122 | 61 | 302 | 2,00 | 0,557 | |
| 3 | Castellanos | 24,6 | 8,5 | 423 | 62,1 | 58,8 | 18,0 | 32,8 | 15 | 100 | 88 | 333 | 1,14 | 0,534 | |
| 4 | Castellanos | 28,8 | 9,7 | 358 | 63,9 | 60,2 | 10,2 | 23,5 | 18 | 103 | 85 | 344 | 1,21 | 0,574 | |
| 5 | Castellanos | 26,4 | 8,9 | 412 | 62,7 | 59,2 | 16,5 | 37,1 | 13 | 129 | 79 | 382 | 1,63 | 0,585 | |
| 6 | Castellanos | 28,1 | 9,2 | 427 | 58,5 | 59,6 | 22,1 | 35,1 | 21 | 104 | 78 | 315 | 1,33 | 0,519 | |
| 7 | La Capital | 18,4 | 6,7 | 449 | 60,5 | 58,1 | 13,7 | 24,2 | 19 | 109 | 68 | 298 | 1,60 | 0,563 | |
| 8 | Las Colonias | 23,5 | 7,8 | 403 | 55,3 | 57,8 | 16,7 | 36,7 | 11 | 100 | 92 | 325 | 1,09 | 0,594 | |
| 9 | Las Colonias | 27,7 | 9,1 | 442 | 64,3 | 60,2 | 10,5 | 15,8 | 40 | 116 | 76 | 336 | 1,53 | 0,549 | |
| 10 | Las Colonias | 26,1 | 8,9 | 445 | 65,5 | 57,2 | 14,1 | 23,2 | 28 | 87 | 67 | 234 | 1,30 | 0,581 | |
| 11 |
| 22,5 | 7,8 | 416 | 62,4 | 57,5 | 14,9 | 23,4 | 25 | 113 | 63 | 287 | 1,79 | 0,593 | |
| 12 |
| 23,4 | 7,8 | 429 | 63,0 | 60,2 | 12,5 | 19,9 | 21 | 121 | 56 | 279 | 2,16 | 0,564 | |
| 13 |
| 22,2 | 7,6 | 344 | 58,0 | 57,0 | 9,6 | 15,6 | 42 | 86 | 89 | 272 | 0,97 | 0,562 | |
| 14 |
| 28,1 | 9,5 | 413 | 60,9 | 59,0 | 10,7 | 38,1 | 20 | 95 | 90 | 312 | 1,06 | 0,568 | |