


The 2019 wheat growing season was under cold weather with rains below average. Yields were good, though, ranging from 1,500 to 3,800 kg/ha. The number of grains per square meter was good, protein content ranged from mid to low, expressed in percentages, and test weight was low.
Rains were scarce, particularly in August and September. The crop’s critical growing period and grain filling were under water stress. Heavy rains occurred in October when harvest was approaching, which could explain the low Ph values.
Temperatures ranged from mild to cold from May to October, and there was no damage from frosts.
Crop health: Low incidence of leaf and stem rust even though yellow rust infection was important. Yellow rust infected susceptible varieties with 2 to 3 nodules in the main stem (August 15) up to HB-1.

Wheat Analysis
| Parameters | Minimum | Maximum | Average | Standard Deviation | Variation Coefficient |
|---|---|---|---|---|---|
| Test Weight (kg/hl) | 78,70 | 81,70 | 80,36 | 0,80 | 1,00 |
| Total Damaged Kernels(%) | 0,24 | 3,16 | 1,53 | 0,70 | 45,80 |
| Foreign Material(%) | 0,04 | 0,75 | 0,27 | 0,20 | 73,89 |
| Shrunken and Broken Kernels(%) | 0,30 | 1,00 | 0,63 | 0,19 | 30,84 |
| Yellow Berry Kernels(%) | 9,40 | 31,50 | 18,12 | 5,53 | 30,53 |
| Protein (13,5% Moisture)(%) | 9,2 | 11,2 | 10,2 | 0,5 | 4,62 |
| Protein(dry basis)(%) | 10,6 | 12,9 | 11,8 | 0,5 | 4,62 |
| Weight of 1000 Kernels(g) | 28,90 | 35,02 | 32,55 | 1,58 | 4,86 |
| Ash (% dry basis(%) | 1,654 | 2,126 | 1,854 | 0,098 | 5,28 |
Grade Distribution
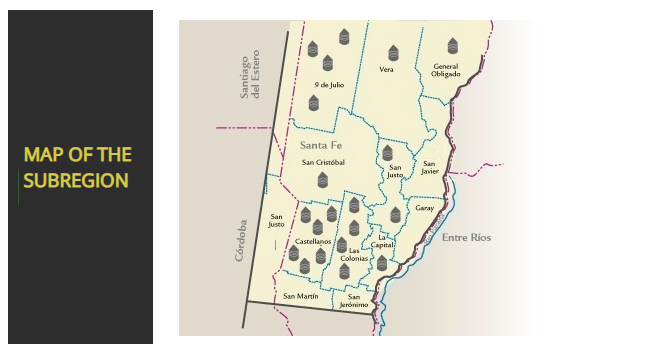
Appendix Of Locality Composite Samples
| Sample Identification | Wheats Analysis | |||||||||||
|---|---|---|---|---|---|---|---|---|---|---|---|---|
| Sample Number | Locality, District or Department | Tonnaje | Grade | Test Weight (Kg/hl) | Total Damaged Kernels (%) | Foreign Material (%) | Shrunken And Broken Kernels (%) | Yellow Berry Kernels (%) | Protein (MOISTURE 13,5 % H°) (%) | Protein (dry basis) (%) | Weight Of 1000 Kernels (g) | Ash (dry basis) (%) |
| 1 | General Obligado | 3650 | 2 | 81,00 | 1,64 | 0,04 | 0,80 | 18,00 | 10,4 | 12,0 | 35,02 | 1,916 |
| 2 | General Obligado | 2800 | 3 | 80,80 | 2,45 | 0,08 | 0,45 | 19,60 | 10,5 | 12,1 | 34,12 | 1,921 |
| 3 | 9 de Julio | 3170 | 1 | 80,50 | 0,24 | 0,75 | 0,30 | 31,50 | 9,3 | 10,8 | 33,34 | 1,948 |
| 4 | 9 de Julio | 2900 | 3 | 80,40 | 1,33 | 0,22 | 0,34 | 27,60 | 9,2 | 10,6 | 33,82 | 1,785 |
| 5 | San Javier | 1420 | 3 | 80,10 | 1,44 | 0,12 | 0,60 | 26,60 | 10,1 | 11,7 | 34,14 | 1,875 |
| 6 | Vera | 1550 | 3 | 80,10 | 2,24 | 0,12 | 0,42 | 18,70 | 10,5 | 12,1 | 32,86 | 1,790 |
| 7 | Castellanos | 3920 | 2 | 80,50 | 0,76 | 0,18 | 0,45 | 20,40 | 10,2 | 11,8 | 32,00 | 1,774 |
| 8 | Castellanos | 3680 | 2 | 80,60 | 0,96 | 0,15 | 0,56 | 17,40 | 10,4 | 12,0 | 28,90 | 1,795 |
| 9 | Castellanos | 4020 | 2 | 80,40 | 1,17 | 0,34 | 0,54 | 16,50 | 9,9 | 11,4 | 31,20 | 1,767 |
| 10 | Castellanos | 3780 | 2 | 79,30 | 1,60 | 0,40 | 0,64 | 13,60 | 10,4 | 12,0 | 30,48 | 1,922 |
| 11 | Castellanos | 3950 | 2 | 81,70 | 1,02 | 0,11 | 0,90 | 11,20 | 10,7 | 12,4 | 33,10 | 1,931 |
| 12 | Castellanos | 4100 | 1 | 81,20 | 0,74 | 0,17 | 0,50 | 10,70 | 10,4 | 12,0 | 31,20 | 1,896 |
| 13 | La Capital | 2790 | 3 | 80,80 | 2,14 | 0,44 | 0,56 | 17,10 | 10,2 | 11,8 | 33,68 | 1,654 |
| 14 | Las Colonias | 4040 | 2 | 78,70 | 1,73 | 0,65 | 0,80 | 10,80 | 10,7 | 12,4 | 32,24 | 1,763 |
| 15 | Las Colonias | 3890 | 2 | 79,40 | 1,90 | 0,22 | 0,94 | 18,20 | 10,0 | 11,6 | 33,26 | 1,901 |
| 16 | Las Colonias | 3820 | 2 | 81,00 | 1,84 | 0,06 | 1,00 | 19,20 | 10,2 | 11,8 | 34,96 | 1,889 |
| 17 | Las Colonias | 4050 | 2 | 79,10 | 1,86 | 0,60 | 0,80 | 24,50 | 9,9 | 11,4 | 31,50 | 1,862 |
| 18 | Las Colonias | 4060 | 2 | 81,30 | 2,26 | 0,08 | 0,44 | 22,40 | 9,6 | 11,1 | 34,30 | 1,747 |
| 19 | San Cristóbal | 3870 | 1 | 80,80 | 0,43 | 0,17 | 0,50 | 9,40 | 11,2 | 12,9 | 32,40 | 2,126 |
| 20 | San Justo | 3880 | 4 | 80,30 | 3,16 | 0,24 | 0,70 | 20,60 | 9,6 | 11,1 | 32,95 | 1,832 |
| 21 | San Justo | 4020 | 2 | 79,50 | 1,80 | 0,42 | 0,65 | 17,50 | 10,4 | 12,0 | 30,56 | 1,787 |
Appendix Of Locality Composite Samples
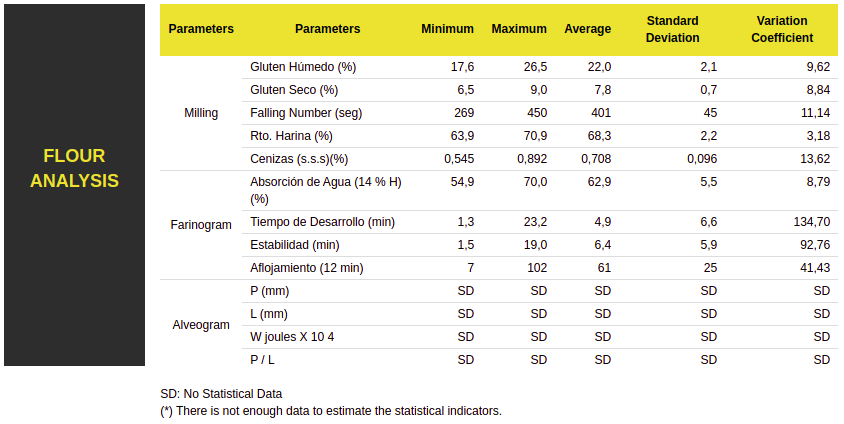
| Sample Identification | Flour Analysis | |||||||||||||
|---|---|---|---|---|---|---|---|---|---|---|---|---|---|---|
| Sample Number | Locality, District or Department | Milling | Farinogram | Alveogram | ||||||||||
| Wet Gluten (%) | Dry Gluten (%) | Falling Number (SEC.) | Flour Yield (%) | Ash (dry basis) (%) | % WA (14 % H°) | D. T. (min.) | Stability (min.) | Degree Softening (12 min.) | P (mm) | L (mm) | W joules x 10 | P / L | ||
| 1 | General Obligado | 22,3 | 7,9 | 269 | 64,1 | 0,715 | 62,7 | 1,6 | 1,9 | 94 | 137 | 39 | 233 | 3,51 |
| 2 | General Obligado | 22,0 | 8,1 | 311 | 69,1 | 0,794 | 58,4 | 1,6 | 2,7 | 68 | ||||
| 3 | 9 de Julio | 18,4 | 6,6 | 375 | 70,4 | 0,809 | 63,3 | 1,8 | 2,3 | 83 | ||||
| 4 | 9 de Julio | 17,9 | 6,5 | 427 | 67,6 | 0,753 | 56,6 | 1,3 | 1,5 | 98 | ||||
| 5 | San Javier | 21,3 | 7,8 | 358 | 70,7 | 0,606 | 66,5 | 1,6 | 1,7 | 82 | ||||
| 6 | Vera | 22,6 | 8,3 | 440 | 64,3 | 0,545 | 58,2 | 1,7 | 3,0 | 47 | ||||
| 7 | Castellanos | 21,9 | 8,2 | 448 | 68,6 | 0,566 | 67,3 | 1,7 | 1,7 | 82 | ||||
| 8 | Castellanos | 22,8 | 7,7 | 425 | 64,0 | 0,692 | 54,9 | 1,8 | 2,5 | 38 | ||||
| 9 | Castellanos | 21,0 | 7,5 | 400 | 69,6 | 0,658 | 63,6 | 1,7 | 2,1 | 70 | ||||
| 10 | Castellanos | 22,0 | 7,7 | 435 | 63,9 | 0,571 | 58,6 | 1,7 | 3,1 | 36 | ||||
| 11 | Castellanos | 20,8 | 7,6 | 430 | 68,2 | 0,670 | 69,4 | 2,2 | 2,2 | 64 | ||||
| 12 | Castellanos | 24,4 | 9,0 | 410 | 69,2 | 0,685 | 57,8 | 1,8 | 10,6 | 40 | ||||
| 13 | La Capital | 17,6 | 6,5 | 400 | 69,0 | 0,742 | 70,0 | 2,5 | 15,6 | 7 | ||||
| 14 | Las Colonias | 24,1 | 8,9 | 450 | 67,0 | 0,562 | 55,8 | 1,5 | 3,7 | 43 | ||||
| 15 | Las Colonias | 23,1 | 7,8 | 395 | 69,0 | 0,827 | 70,0 | 17,6 | 9,9 | 102 | ||||
| 16 | Las Colonias | 23,5 | 8,2 | 420 | 69,5 | 0,788 | 58,4 | 1,8 | 9,9 | 41 | ||||
| 17 | Las Colonias | 22,0 | 7,6 | 353 | 69,6 | 0,781 | 70,0 | 17,5 | 18,6 | 74 | ||||
| 18 | Las Colonias | 20,5 | 7,3 | 376 | 70,8 | 0,603 | 59,6 | 1,5 | 1,8 | 62 | ||||
| 19 | San Cristóbal | 26,5 | 8,9 | 420 | 68,4 | 0,892 | 70,0 | 23,2 | 11,9 | 66 | ||||
| 20 | San Justo | 20,4 | 7,2 | 445 | 70,9 | 0,797 | 57,9 | 1,5 | 2,0 | 74 | ||||
| 21 | San Justo | 24,2 | 8,0 | 398 | 69,5 | 0,726 | 70,0 | 7,8 | 19,0 | 14 | ||||