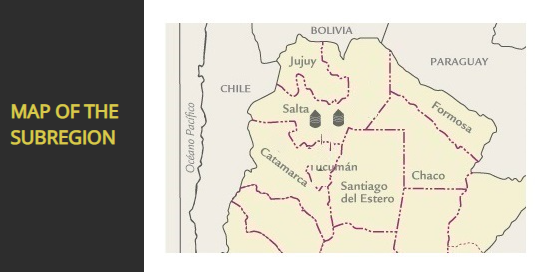

2019/2020 wheat planted area in the province of Tucumán was approximately 96,000 ha (93,000 bread wheat and 3,000 white bread); yield was about 12 q/ha; quality ranged from regular to good.
There was some washed wheat with some drop in gluten content due to rains at maturity and harvest.


Wheat Analysis
| Parameters | Minimum | Maximum | Average | Standard Deviation | Variation Coefficient |
|---|---|---|---|---|---|
| Test Weight (kg/hl) | 80,60 | 81,40 | 81,06 | 0,40 | 0,49 |
| Total Damaged Kernels(%) | 0,04 | 0,41 | 0,25 | 0,18 | 72,83 |
| Foreign Material(%) | 0,48 | 0,50 | 0,49 | 0,01 | 2,01 |
| Shrunken and Broken Kernels(%) | 0,12 | 0,68 | 0,36 | 0,28 | 76,99 |
| Yellow Berry Kernels(%) | 2,68 | 4,00 | 3,25 | 0,65 | 20,13 |
| Protein (13,5% Moisture)(%) | 12,2 | 12,9 | 12,5 | 0,3 | 2,65 |
| Protein(dry basis)(%) | 14,1 | 14,9 | 14,5 | 0,4 | 2,65 |
| Weight of 1000 Kernels(g) | 33,38 | 34,97 | 34,29 | 0,79 | 2,29 |
| Ash (% dry basis(%) | 1,815 | 1,850 | 1,830 | 0,017 | 0,95 |
Grade Distribution
Flour Analysis
| Parameters | Parameters | Minimum | Maximum | Average | Standard Deviation | Variation Coefficient |
|---|---|---|---|---|---|---|
Milling |
Gluten Húmedo (%) | 22,02 | 30,63 | 25,80 | 1,84 | 7,14 |
| Gluten Seco (%) | 7,81 | 10,58 | 9,13 | 0,60 | 6,54 | |
| Falling Number (seg) | 374,71 | 453,05 | 428,77 | 14,87 | 3,47 | |
| Rto. Harina (%) | 64,16 | 72,38 | 68,98 | 1,40 | 2,04 | |
| Cenizas (s.s.s)(%) | 0,56 | 0,71 | 0,60 | 0,05 | 7,86 | |
Farinogram |
Absorción de Agua (14 % H)(%) | 55,19 | 62,90 | 56,67 | 1,75 | 3,10 |
| Tiempo de Desarrollo (min) | 4,89 | 17,94 | 8,64 | 3,57 | 41,31 | |
| Estabilidad (min) | 6,38 | 34,45 | 19,18 | 6,42 | 33,49 | |
| Aflojamiento (12 min) | 13,73 | 72,97 | 33,15 | 13,02 | 39,29 | |
Alveogram |
P(mm) | 6,82 | 107,27 | 79,41 | 17,46 | 21,98 |
| L (mm) | 1,94 | 117,10 | 91,39 | 26,75 | 29,27 | |
| W joules X 10 4 | 11,59 | 349,60 | 261,39 | 67,40 | 25,78 | |
| P / L | 0,17 | 1,85 | 0,95 | 0,39 | 40,74 |
Appendix Of Locality Composite Samples
| Sample Identification | Wheats Analysis | |||||||||||
|---|---|---|---|---|---|---|---|---|---|---|---|---|
| Sample Number | Locality, District or Department | Tonnaje | Grade | Test Weight (Kg/hl) | Total Damaged Kernels (%) | Foreign Material (%) | Shrunken And Broken Kernels (%) | Yellow Berry Kernels (%) | Protein (MOISTURE 13,5 % H°) (%) | Protein (dry basis) (%) | Weight Of 1000 Kernels (g) | Ash (dry basis) (%) |
| 1 | Salta | 4000 | 2 | 81,40 | 0,41 | 0,50 | 0,12 | 2,68 | 12,2 | 14,1 | 34,97 | 1,815 |
| 2 | Salta | 3000 | 2 | 80,60 | 0,04 | 0,48 | 0,68 | 4,00 | 12,9 | 14,9 | 33,38 | 1,850 |
Appendix Of Locality Composite Samples
| Sample Identification | Flour Analysis | |||||||||||||
|---|---|---|---|---|---|---|---|---|---|---|---|---|---|---|
| Sample Number | Locality, District or Department | Milling | Farinogram | Alveogram | ||||||||||
| Wet Gluten (%) | Dry Gluten (%) | Falling Number (SEC.) | Flour Yield (%) | Ash (dry basis) (%) | % WA (14 % H°) | D. T. (min.) | Stability (min.) | Degree Softening (12 min.) | P (mm) | L (mm) | W joules x 10 | P / L | ||
| 1 | Salta | 25,3 | 9,4 | 364 | 64,4 | 0,575 | 58,4 | 7,8 | 12,1 | 55 | 99 | 64 | 240 | 1,55 |
| 2 | Salta | 23,9 | 8,9 | 389 | 63,8 | 0,579 | 57,4 | 10,9 | 14,6 | 42 | 99 | 60 | 234 | 1,65 |


