


 SUBREGION NOA
Wheat Campaign 2013/14 was the worst regarding productivity in the last 30 years or more, as a consequence of a very strong drought during January, February and March 2013, which caused significant losses in soy, maize, bean, chia and peanut.
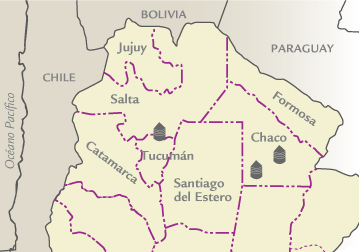
This resulted in a scarce water supply in the soil profiles intended for sowing wheat, resulting in a significant decrease in crop area. Only those plots with possibility of watering either by flooding or sprinkling could be sown. Wheat area reached 13,995 ha in Salta and Jujuy provinces and 12,870 in Tucumán province.
Wheat crop cycles were shortened during June due to the high temperatures registered. Then, there were some losses due to low temperatures and frosts for several days in July and August, and the low accumulation of water in the soil profile. Low temperatures registered were among -6 ºC and -8 ºC.
An estimated 19,500 ha were harvested, with yields between 1000 and 2400 kg/ha, but some lots reached 2600-2800 kg/ha.
| MAP OF THE SUBREGION |
|
| ||||||||||||||||||||||||||||||||||||||||||||||||||||||||||||||||||||||
| GRADE DISTRIBUTION |
|
| FLOUR ANALYSIS | PARAMETERS | MINIMUM | MAXIMUM | AVERAGE | STANDARD DEVIATION | VARIATION COEFFICIENT | |||
| MILLING | Wet Gluten (%) | 28,3 | 35,5 | 31,4 | 3,0 | 0,10 | |||
| Dry Gluten (%) | 9,9 | 13,2 | 11,4 | 1,4 | 0,12 | ||||
| Falling Number (seg.) | 375 | 435 | 397 | 25 | 0,06 | ||||
| Flour Yield (%) | 69,7 | 71,9 | 70,7 | 1,1 | 0,02 | ||||
| Ash (dry basis) (%) | 0,67 | 1,1 | 0,813 | 0,186 | 0,23 | ||||
| FARINOGRAM | Water Absorption(14 % H°) (%) | 57,6 | 62,0 | 59,9 | 1,7 | 0,03 | |||
| Development Time (min.) | 5,3 | 10,3 | 7,6 | 2,1 | 0,28 | ||||
| Stability (min.) | 8,4 | 17,4 | 11,9 | 3,7 | 0,31 | ||||
| Degree of Softening (12 min.) | 46 | 71 | 60 | 10 | 0,16 | ||||
| P (mm) | 84 | 102 | 96 | 8 | 0,08 | ||||
| ALVEOGRAM | |||||||||
| L (mm) | 71 | 87 | 79 | 6 | 0,08 | ||||
| W Joules x 10-4 | 263 | 289 | 276 | 11 | 0,04 | ||||
| P / L | 0,97 | 1,41 | 1,23 | 0,17 | 0,14 | ||||
| These results were elaborated with 5 composite samples prepared proportionally from 31 primary samples (farmer deliveries) | |||||||||
SUBREGION DATA
In this subregion the wheat production was 63,560 tons., the 0.7% of the national total.Were sampled 8,000 tons., the 12.59 % of the subregion production.
| APPENDIX OF LOCALITY COMPOSITE SAMPLES | |||||||||||||
| SAMPLE IDENTIFICATION | WHEAT ANALYSIS | ||||||||||||
| SAMPLE NUMBER | LOCALITY, DISTRICT OR DEPARTMENT | TONNAJE | GRADE | TEST WEIGT (Kg/hl) | TOTAL DAMAGED KERNELS(%) | FOREIGN MATERIAL (%) |
SHRUNKEN AND BROKEN KERNELS (%) | YELLOW BERRY KERNELS(%) | PROTEIN (MOISTURE 13,5 % H°) |
PROTEIN (s/S.S.S.) | WEIGT OF 1000 KERNELS | ASH(dry basis)(%) | |
| 1 | Saenz Peña | 3000 | 2 | 77,25 | 0,48 | 0,66 | 0,86 | 0,44 | 12,7 | 14,7 | 29,80 | 1,770 | |
| 2 | Charata | 3000 | 2 | 77,90 | 0,82 | 0,50 | 0,34 | 3,40 | 13,3 | 15,4 | 30,80 | 1,920 | |
| 3 | Anta-Tucumán-Metán | 2000 | 2 | 80,35 | 0,22 | 0,34 | 0,32 | 0,16 | 11,9 | 13,8 | 35,11 | 1,926 | |
| APPENDIX OF LOCALITY COMPOSITE SAMPLES | |||||||||||||||
| SAMPLE IDENTIFICATION | FLOUR ANALYSIS | ||||||||||||||
| SAMPLE NUMBER | LOCALITY, DISTRICT OR DEPARTMENT | WET GLUTEN (%) | DRY GLUTEN(%) | FALLING NUMBER (SEG.) | FLOUR YIELD(%) | FARINOGRAM | ALVEOGRAM | ASH(dry basis)(%) | |||||||
| % AA (14 % H°) | T, D, (MIN,) | STABILITY (MIN,) | DEGREE SOFTENING(12 MIN,) | P | L | W | P/L | ||||||||
| 1 | Saenz Peña | 32,0 | 11,8 | 392 | 69,8 | 57,6 | 10,3 | 17,4 | 46 | 84 | 87 | 271 | 0,97 | 0,735 | |
| 2 | Charata | 35,5 | 13,2 | 435 | 69,7 | 62,0 | 8,2 | 11,6 | 71 | 100 | 71 | 263 | 1,41 | 1,104 | |
| 3 | Anta-Tucumán-Metán | 28,3 | 9,9 | 375 | 71,9 | 60,1 | 5,3 | 8,4 | 61 | 102 | 79 | 289 | 1,29 | 0,671 | |