


 SUBREGION NOA
Planting extended from late April to early May. Water availability in the soil ranged from good to regular. Planted acreage decreased, especially in the north of Salta, in Oran and Libertador General San Martin Departments, the consequence of the little moisture accumulated in the summer.
Planting continued at proper pace. Planted wheat was under irrigation or dryland farming, depending on soil conditions.
The first months benefited from showers and drizzles as well as from cool temperatures.
In August, early high temperatures affected wheat under dryland farming and, to a lesser extent, plots under irrigation and floods, especially in the northern area of the province of Salta.
Starting in September and all through October and November, high temperatures shortened growth stages up to maturing. Yields were negatively affected by the low temperatures and frosts of late July, part of August and first days of September.
Harvest started in mid-October and ended by the end of November. Yields were lower than expected, ranging from 1,200 to 2,500 kg/ha with good to regular grain quality. Yields in some plots were either lower or higher. Some plots were not harvested.
Yields were very irregular but good when compared to previous years. Some plots were lost due to rains by the end of the harvest. Grain quality was affected by stained and sprouted kernels.
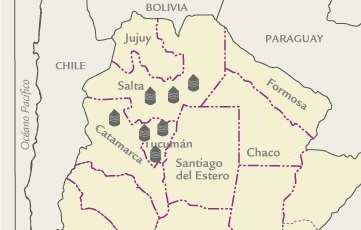
| MAP OF THE SUBREGION |
|
| ||||||||||||||||||||||||||||||||||||||||||||||||||||||||||||||||||||||
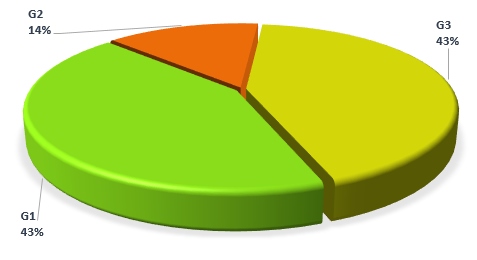
| GRADE DISTRIBUTION |
|
| FLOUR ANALYSIS | PARAMETERS | MINIMUM | MAXIMUM | AVERAGE | STANDARD DEVIATION | VARIATION COEFFICIENT | |||
| MILLING | Wet Gluten (%) | 24,8 | 32,1 | 29,0 | 2,7 | 9,3 | |||
| Dry Gluten (%) | 9,2 | 11,9 | 10,7 | 1,0 | 9,23 | ||||
| Falling Number (seg.) | 244 | 376 | 321 | 46 | 14,26 | ||||
| Flour Yield (%) | 59,6 | 60,2 | 60,0 | 0,2 | 0,35 | ||||
| Ash (dry basis) (%) | 0,497 | 0,652 | 0,616 | 0,054 | 6,75 | ||||
| FARINOGRAM | Water Absorption (14 % H°)(%) | 56,5 | 61,9 | 59,9 | 2,1 | 3,50 | |||
| Development Time(min.) | 5,7 | 20,0 | 9,4 | 5,1 | 54,02 | ||||
| Stability (min.) | 7,2 | 36,5 | 16,1 | 10,5 | 65,48 | ||||
| Degree of Softening (12 min.) | 3 | 67 | 40 | 26 | 65,69 | ||||
| P (mm) | 78 | 117 | 100 | 17 | 16,73 | ||||
| ALVEOGRAM | |||||||||
| L (mm) | 53 | 82 | 75 | 10 | 13,74 | ||||
| W Joules x 10-4 | 215 | 379 | 269 | 59 | 21,87 | ||||
| P / L | 0,98 | 2,15 | 1,33 | 0,41 | 31,00 | ||||
| These results were elaborated with 7 composite samples prepared proportionally from 32 primary samples. | |||||||||
SUBREGION DATA
In this sub region the wheat production was 521.412 tons., the 2,8% of the national total. Were sampled 24.000 tons., the 4,6% of the sub region production.
| APPENDIX OF LOCALITY COMPOSITE SAMPLES | |||||||||||||
| SAMPLE IDENTIFICATION | WHEAT ANALYSIS | ||||||||||||
| SAMPLE NUMBER | LOCALITY, DISTRICT OR DEPARTMENT | TONNAJE | GRADE | TEST WEIGT (Kg/hl) | TOTAL DAMAGED KERNELS(%) | FOREIGN MATERIAL (%) | GSHRUNKEN AND BROKEN KERNELS(%) | YELLOW BERRY KERNELS (%) | PROTEIN(MOISTURE 13,5 % H°) | PROTEIN(s/S.S.S.) | WEIGT OF 1000 KERNELS (gr.) | ASH (dry basis) % | |
| 4 | Tucumán | 4000 | 1 | 82,15 | 0,07 | 0,14 | 0,32 | 4,16 | 10,8 | 12,5 | 36,52 | 1,693 | |
| 5 | Tucumán | 4000 | 1 | 83,50 | 0,13 | 0,12 | 0,04 | 4,38 | 11,4 | 13,2 | 36,44 | 1,663 | |
| 6 | Tucumán | 4000 | 1 | 81,95 | 0,07 | 0,15 | 0,41 | 3,78 | 12,1 | 14,0 | 33,58 | 1,860 | |
| 8 | Catamarca | 2000 | 3 | 80,80 | 0,04 | 0,45 | 0,24 | 1,30 | 12,6 | 14,6 | 34,52 | 1,243 | |
| 9 | Salta | 4000 | 2 | 83,50 | 0,32 | 0,53 | 0,26 | 2,92 | 12,2 | 14,1 | 35,99 | 1,960 | |
| 10 | Salta | 4000 | 3 | 80,80 | 0,18 | 0,87 | 0,27 | 1,78 | 11,5 | 13,3 | 36,02 | 1,748 | |
| 11 | Salta | 2000 | 3 | 82,15 | 0,22 | 0,86 | 0,15 | 2,04 | 12,3 | 14,2 | 35,50 | 1,866 | |
| APPENDIX OF LOCALITY COMPOSITE SAMPLES | |||||||||||||||
| SAMPLE IDENTIFICATION | FLOUR ANALYSIS | ||||||||||||||
| SAMPLE NUMBER | LOCALITY, DISTRICT OR DEPARTMENT | WET GLUTEN(%) | DRY GLUTEN(%) | FALLING NUMBER (seg.) | FLOUR YIELD(%) | FARINOGRAMA | ALVEOGRAMA | ASH(dry basis)(%) | |||||||
| % AA (14 % H°) | D. T. (min.) | STABILITY (min.) | DEGREE SOFTENING(12 min.) | P | L | W | P/L | ||||||||
| 4 | Tucumán | 24,8 | 9,2 | 289 | 60,2 | 56,5 | 6,4 | 10,2 | 64 | 78 | 80 | 215 | 0,98 | 0,642 | |
| 5 | Tucumán | 26,5 | 9,8 | 352 | 60,0 | 58,1 | 11,2 | 22,0 | 23 | 112 | 73 | 304 | 1,53 | 1,615 | |
| 6 | Tucumán | 30,0 | 11,1 | 354 | 59,9 | 60,7 | 9,0 | 17,9 | 19 | 107 | 74 | 287 | 1,45 | 0,638 | |
| 8 | Catamarca | 29,9 | 11,1 | 244 | 59,6 | 58,8 | 20,0 | 36,5 | 3 | 117 | 81 | 379 | 1,44 | 0,497 | |
| 9 | Salta | 31,7 | 11,7 | 331 | 60,1 | 61,6 | 5,7 | 7,2 | 67 | 88 | 81 | 226 | 1,09 | 0,652 | |
| 10 | Salta | 28,0 | 10,4 | 376 | 60,0 | 61,6 | 7,8 | 11,7 | 37 | 114 | 53 | 235 | 2,15 | 0,628 | |
| 11 | Salta | 32,1 | 11,9 | 300 | 60,2 | 61,9 | 5,7 | 7,2 | 67 | 81 | 82 | 235 | 0,99 | 0,642 | |