


 SUBREGION III
Rainfall from February to April reloaded the soil profile. At planting, soil moisture was optimum across the region. However, from May to September, rainfall was below average: Boot stage was shortened and the number of fertile boots in late planted cultivars was lower. Intermediate and short cycle varities were planted late in the season.
Rainfall in October and November was average.
Temperatures were below average in May (-1,8°C), June (-1,5°C), July (-0,3°C) and September (-0,1°C), above average in August (+1,7°C) , and almost average in October and November, which favored proper grain filling.
Foliar diseases were favored by weather conditions from mid-October to November: stem rust (Puccinia graminis-tritici), leaf rust (Puccinia triticina) and stripe rust (Puccinia striiformis). The incidence recorded was significant only in susceptible and very susceptible late planted varieties. Yields were not generally affected by these attacks since it was already the grain filling stage.
Following data published by the Entre Rios Board of Trade (SIBER Bolsacer - Reports) - www.bolsacer.org.ar), average production increased 54% compared to last year volumes: there was a increase in the area planted of 41% and average yield increased 10%. The provincial average yield for the 2016/2017 wheat season was 3,238 kg/h.
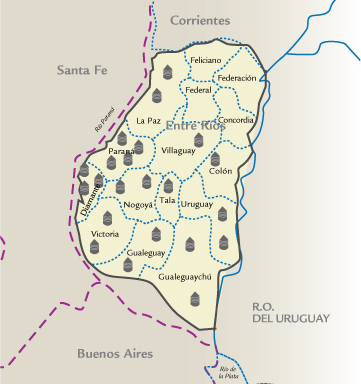
| | MAP OF THE SUBREGION |
|
| |||||||||||||||||||||||||||||||||||||||||||||||||||||||||||||||||||||||
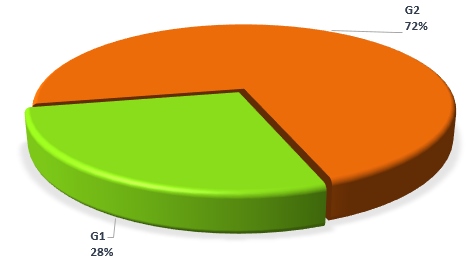
| GRADE DISTRIBUTION |
|
| FLOUR ANALYSIS | PARAMETERS | MINIMUM | MAXIMUM | AVERAGE | STANDARD DEVIATION | VARIATION COEFFICIENT | |||
| MILLING | Wet Gluten (%) | 21,2 | 26,6 | 24,4 | 1,2 | 4,92 | |||
| Dry Gluten (%) | 7,9 | 9,6 | 8,8 | 0,4 | 4,19 | ||||
| Falling Number (sec.) | 286 | 427 | 380 | 34 | 9,05 | ||||
| Flour Yield (%) | 50,5 | 63,0 | 58,5 | 2,8 | 4,80 | ||||
| Ash (dry basis) (%) | 0,493 | 0,729 | 0,542 | 0,044 | 8,12 | ||||
| FARINOGRAM | Water Absorption (14 % H°) (%) | 53,2 | 56,5 | 55,6 | 0,7 | 1,29 | |||
| Development Time (min.) | 3,1 | 20,0 | 9,0 | 3,7 | 41,32 | ||||
| Stability (min.) | 11,3 | 38,8 | 18,1 | 5,5 | 30,35 | ||||
| Degree of Softening (12 min.) | 8 | 61 | 33 | 12 | 36,86 | ||||
| P (mm) | 65 | 104 | 84 | 11 | 12,99 | ||||
| ALVEOGRAM | |||||||||
| L (mm) | 51 | 106 | 79 | 15 | 19,42 | ||||
| W Joules x 10-4 | 191 | 283 | 235 | 21 | 9,15 | ||||
| P / L | 0,68 | 2,02 | 1,06 | 0,39 | 36,79 | ||||
| These results were elaborated with 29 composite samples prepared proportionally from 509 primary samples (farmer deliveries) | |||||||||
SUBREGION DATA
In this sub region the wheat production was 1.121.848 tons., the 6.1%% of the national total. Were sampled 99.035 tons., the 8.8% of the sub region production.
| APPENDIX OF LOCALITY COMPOSITE SAMPLES | |||||||||||||
| SAMPLE IDENTIFICATION | WHEAT ANALYSIS | ||||||||||||
| SAMPLE NUMBER | LOCALITY, DISTRICT OR DEPARTMENT | TONNAJE | GRADE | TEST WEIGT (Kg/hl) | TOTAL DAMAGED KERNELS(%) | FOREIGN MATERIAL (%) | SHRUNKEN AND BROKEN KERNELS(%) | YELLOW BERRY KERNELS (%) | PROTEIN (MOISTURE 13,5 % H°) |
PROTEIN (s/S.S.S.) | WEIGT OF 1000 KERNELS | ASH(dry basis) % | |
| 301 | Paraná | 4070 | 2 | 81,10 | 0,29 | 0,21 | 0,63 | 6,90 | 10,2 | 11,8 | 37,76 | 1,660 | |
| 302 | Paraná | 3975 | 1 | 81,40 | 0,64 | 0,20 | 0,46 | 9,14 | 10,0 | 11,6 | 39,46 | 1,880 | |
| 303 | Paraná | 4045 | 2 | 82,00 | 0,53 | 0,17 | 0,80 | 6,90 | 10,7 | 12,4 | 39,18 | 1,880 | |
| 304 | Paraná | 4090 | 2 | 81,40 | 0,75 | 0,19 | 0,80 | 6,34 | 10,7 | 12,4 | 38,94 | 1,700 | |
| 305 | Paraná | 4190 | 1 | 81,80 | 0,43 | 0,10 | 0,45 | 5,10 | 10,9 | 12,6 | 39,76 | 1,970 | |
| 306 | Federal | 2045 | 2 | 79,30 | 0,32 | 0,21 | 0,61 | 7,80 | 10,9 | 12,6 | 40,12 | 1,670 | |
| 307 | Villaguay | 2040 | 1 | 81,20 | 0,37 | 0,09 | 0,17 | 5,60 | 10,6 | 12,3 | 42,04 | 1,820 | |
| 308 | Diamante | 3985 | 2 | 83,20 | 0,22 | 0,25 | 0,35 | 8,70 | 10,2 | 11,8 | 40,82 | 1,410 | |
| 309 | Diamante | 3960 | 2 | 81,70 | 0,43 | 0,26 | 0,45 | 9,40 | 10,0 | 11,6 | 41,20 | 1,880 | |
| 310 | Diamante | 4180 | 2 | 80,80 | 0,51 | 0,71 | 0,31 | 8,40 | 10,5 | 12,1 | 40,68 | 1,800 | |
| 311 |
| 4010 | 2 | 81,10 | 0,65 | 0,25 | 0,45 | 6,95 | 10,6 | 12,3 | 40,16 | 1,780 | |
| 312 |
| 1155 | 2 | 81,90 | 0,30 | 0,11 | 0,55 | 4,81 | 10,8 | 12,5 | 39,74 | 1,810 | |
| 313 |
| 4180 | 2 | 78,70 | 0,32 | 0,47 | 0,60 | 8,08 | 10,1 | 11,7 | 36,50 | 1,660 | |
| 314 |
| 4090 | 2 | 80,00 | 0,32 | 0,16 | 1,05 | 6,50 | 10,6 | 12,3 | 37,68 | 1,710 | |
| 315 |
| 2285 | 2 | 80,40 | 0,85 | 0,14 | 0,51 | 11,50 | 9,7 | 11,2 | 38,88 | 1,640 | |
| 316 |
| 3945 | 2 | 82,00 | 0,65 | 0,29 | 0,47 | 11,35 | 10,0 | 11,6 | 38,68 | 1,597 | |
| 317 |
| 4205 | 2 | 79,90 | 0,64 | 0,59 | 0,45 | 9,48 | 10,2 | 11,8 | 37,84 | 1,585 | |
| 318 |
| 2130 | 2 | 81,10 | 0,61 | 0,31 | 0,50 | 10,01 | 10,3 | 11,9 | 39,88 | 1,593 | |
| 319 |
| 4025 | 1 | 80,00 | 0,20 | 0,19 | 0,19 | 9,80 | 10,0 | 11,6 | 38,00 | 1,766 | |
| 320 |
| 3945 | 1 | 80,70 | 0,52 | 0,12 | 0,22 | 6,90 | 10,4 | 12,0 | 38,42 | 1,712 | |
| 321 |
| 2105 | 2 | 80,10 | 0,79 | 0,32 | 0,61 | 7,42 | 10,4 | 12,0 | 38,94 | 1,706 | |
| 322 |
| 4120 | 2 | 81,00 | 0,35 | 0,30 | 0,35 | 6,50 | 9,9 | 11,4 | 40,16 | 1,716 | |
| 323 |
| 4160 | 2 | 80,40 | 0,73 | 0,41 | 0,41 | 5,50 | 10,2 | 11,8 | 41,68 | 1,695 | |
| 324 |
| 1965 | 2 | 80,70 | 0,56 | 0,20 | 0,93 | 7,12 | 10,4 | 12,0 | 40,38 | 1,733 | |
| 325 |
| 4105 | 1 | 81,70 | 0,45 | 0,12 | 0,20 | 6,05 | 10,0 | 11,6 | 39,08 | 1,745 | |
| 326 |
| 2015 | 1 | 81,50 | 0,67 | 0,17 | 0,40 | 7,05 | 10,4 | 12,0 | 39,78 | 1,710 | |
| 327 |
| 3945 | 2 | 82,00 | 0,40 | 0,22 | 0,18 | 9,27 | 10,0 | 11,6 | 40,26 | 1,708 | |
| 328 |
| 4110 | 2 | 80,30 | 0,29 | 0,27 | 0,27 | 7,59 | 10,3 | 11,9 | 39,28 | 1,760 | |
| 329 |
| 1960 | 1 | 81,10 | 0,37 | 0,16 | 0,20 | 9,10 | 10,2 | 11,8 | 38,72 | 1,790 | |
| APPENDIX OF LOCALITY COMPOSITE SAMPLES | |||||||||||||||
| SAMPLE IDENTIFICATION | FLOUR ANALYSIS | ||||||||||||||
| SAMPLE NUMBER | LOCALITY,DISTRICT OR DEPARTMENT | WET GLUTEN(%) | DRY GLUTEN(%) | FALLING NUMBER (SEC.) | FLOUR YIELD(%) | FARINOGRAMA | ALVEOGRAMA | ASH(dry basis)(%) | |||||||
| % WA(14% H°) | T, D, (MIN.) | STABILITY (MIN.) | DEGREE SOFTENING (12 MIN.) | P | L | W | P/L | ||||||||
| 301 | Paraná | 24,3 | 8,4 | 375 | 61,3 | 55,6 | 12,3 | 21,3 | 29 | 91 | 76 | 248 | 1,20 | 0,545 | |
| 302 | Paraná | 24,9 | 8,8 | 368 | 57,9 | 55,8 | 7,8 | 15,7 | 37 | 77 | 89 | 233 | 0,87 | 0,515 | |
| 303 | Paraná | 25,4 | 8,9 | 406 | 58,8 | 56,2 | 8,0 | 13,3 | 45 | 78 | 97 | 251 | 0,80 | 0,545 | |
| 304 | Paraná | 25,6 | 9,0 | 409 | 58,3 | 56,2 | 8,4 | 13,2 | 49 | 71 | 96 | 233 | 0,74 | 0,535 | |
| 305 | Paraná | 26,6 | 9,6 | 421 | 58,5 | 56,4 | 9,0 | 15,5 | 44 | 74 | 106 | 265 | 0,70 | 0,555 | |
| 306 | Federal | 25,4 | 9,0 | 410 | 58,9 | 56,2 | 8,5 | 11,3 | 61 | 69 | 101 | 229 | 0,68 | 0,535 | |
| 307 | Villaguay | 25,0 | 8,8 | 427 | 55,2 | 56,4 | 8,5 | 13,4 | 51 | 74 | 104 | 253 | 0,71 | 0,555 | |
| 308 | Diamante | 24,0 | 8,6 | 363 | 57,4 | 56,4 | 8,7 | 16,4 | 31 | 82 | 87 | 243 | 0,94 | 0,545 | |
| 309 | Diamante | 23,7 | 8,6 | 353 | 59,2 | 55,7 | 10,5 | 15,9 | 43 | 83 | 72 | 219 | 1,15 | 0,555 | |
| 310 | Diamante | 25,4 | 8,8 | 362 | 55,8 | 56,3 | 10,4 | 15,8 | 38 | 77 | 83 | 223 | 0,93 | 0,535 | |
| 311 | Diamante | 24,9 | 8,8 | 374 | 53,6 | 56,0 | 9,5 | 16,3 | 38 | 84 | 95 | 283 | 0,88 | 0,535 | |
| 312 | Concordia | 26,6 | 9,3 | 368 | 53,9 | 56,5 | 9,8 | 17,4 | 30 | 90 | 84 | 260 | 1,07 | 0,525 | |
| 313 | La Paz | 23,3 | 8,4 | 286 | 50,5 | 55,0 | 10,9 | 16,4 | 49 | 84 | 83 | 248 | 1,01 | 0,525 | |
| 314 | La Paz | 25,6 | 8,9 | 331 | 54,3 | 55,6 | 10,6 | 17,2 | 39 | 84 | 90 | 264 | 0,93 | 0,585 | |
| 315 | Tala | 23,3 | 8,8 | 352 | 55,7 | 54,5 | 12,9 | 26,0 | 14 | 89 | 79 | 252 | 1,13 | 0,505 | |
| 316 | Gualeguay | 23,2 | 8,6 | 398 | 63,0 | 55,8 | 15,1 | 27,3 | 14 | 101 | 57 | 228 | 1,77 | 0,547 | |
| 317 | Gualeguay | 22,7 | 8,4 | 418 | 59,5 | 55,5 | 3,1 | 15,3 | 25 | 104 | 54 | 227 | 1,93 | 0,555 | |
| 318 | Gualeguay | 23,7 | 8,8 | 388 | 60,1 | 54,9 | 10,8 | 17,3 | 30 | 74 | 85 | 227 | 0,87 | 0,493 | |
| 319 | Gualeguaychu | 23,8 | 8,8 | 408 | 60,5 | 54,4 | 20,0 | 38,8 | 8 | 93 | 59 | 213 | 1,58 | 0,515 | |
| 320 | Gualeguaychu | 23,8 | 8,8 | 400 | 60,5 | 55,4 | 4,7 | 15,9 | 29 | 96 | 68 | 248 | 1,41 | 0,550 | |
| 321 | Gualeguaychu | 23,6 | 8,8 | 319 | 60,8 | 54,8 | 4,5 | 22,9 | 17 | 82 | 81 | 248 | 1,01 | 0,547 | |
| 322 | Nogoyá | 21,2 | 7,9 | 397 | 60,1 | 55,4 | 4,4 | 15,6 | 25 | 103 | 51 | 213 | 2,02 | 0,498 | |
| 323 | Nogoyá | 23,7 | 8,8 | 399 | 60,0 | 56,4 | 8,8 | 16,1 | 40 | 98 | 67 | 241 | 1,46 | 0,524 | |
| 324 | Nogoyá | 24,1 | 9,2 | 409 | 60,0 | 55,8 | 11,4 | 20,3 | 31 | 83 | 80 | 238 | 1,04 | 0,521 | |
| 325 | Uruguay | 24,9 | 9,2 | 321 | 59,5 | 54,9 | 3,5 | 17,8 | 23 | 92 | 59 | 209 | 1,56 | 0,729 | |
| 326 | Uruguay | 25,4 | 9,4 | 417 | 59,7 | 55,8 | 7,8 | 14,6 | 43 | 83 | 79 | 225 | 1,05 | 0,537 | |
| 327 | Victoria | 24,9 | 9,2 | 389 | 60,5 | 54,5 | 4,1 | 17,6 | 24 | 67 | 89 | 209 | 0,75 | 0,497 | |
| 328 | Victoria | 25,7 | 9,5 | 395 | 60,4 | 54,7 | 8,4 | 17,7 | 30 | 65 | 82 | 191 | 0,79 | 0,529 | |
| 329 | Victoria | 23,2 | 8,6 | 384 | 60,2 | 53,2 | 9,7 | 25,2 | 10 | 77 | 65 | 193 | 1,18 | 0,504 | |