


 SUBREGION III
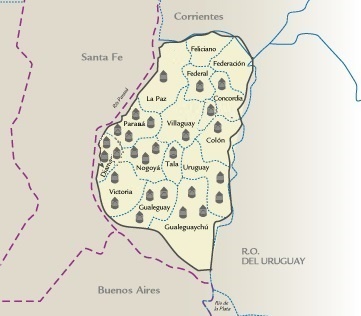
| | MAP OF THE SUBREGION |
 |
| |||||||||||||||||||||||||||||||||||||||||||||||||||||||||||||||||||||||
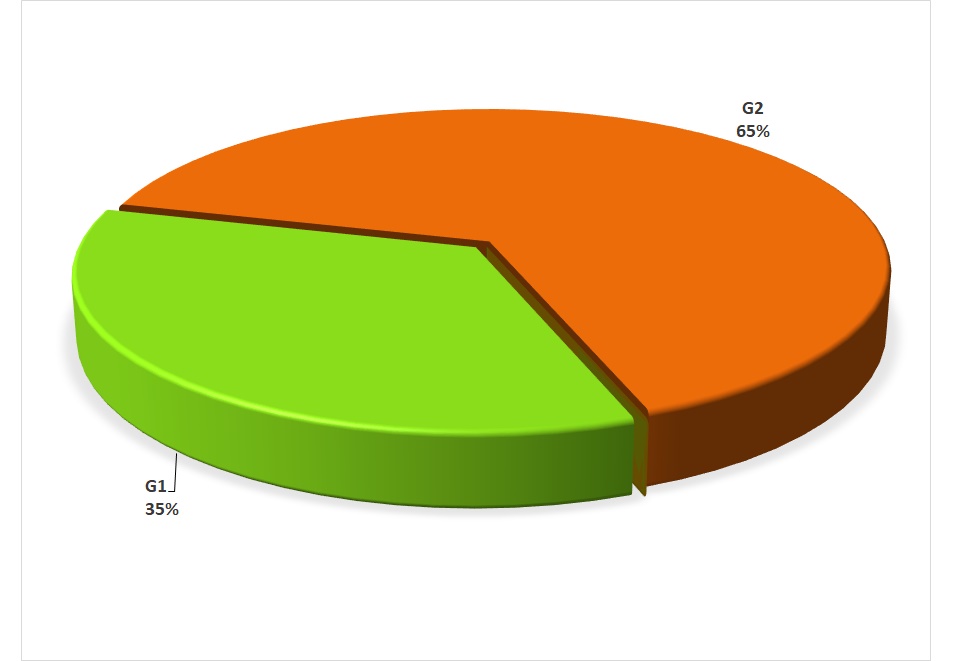
| | GRADE DISTRIBUTION |
|
| FLOUR ANALYSIS |
PARAMETERS | MINIMUM | MAXIMUM | AVERAGE |
STANDARD DEVIATION |
VARIATION COEFFICIENT | |||
| MILLING | Wet Gluten (%) | 18,3 | 25,3 | 22,0 | 1,5 | 6,93 | |||
| Dry Gluten (%) | 6,7 | 9,1 | 8,0 | 0,6 | 6,95 | ||||
| Falling Number (s) | 302 | 398 | 345 | 24 | 6,91 | ||||
| Flour Yield (%) | 62,10 | 66,00 | 64,08 | 1,04 | 1,62 | ||||
| Ash (dry basis) (%) | 0,322 | 0,556 | 0,448 | 0,066 | 14,68 | ||||
| FARINOGRAM | Water Absorption (14%H°)(%) | 52,8 | 57,5 | 55,6 | 1,1 | 2,04 | |||
| Development Time (min.) | 1,6 | 14,4 | 6,5 | 4,8 | 74,81 | ||||
| Stability (min.) | 1,9 | 26,0 | 12,9 | 9,2 | 71,40 | ||||
| Degree of Softening(12 min.) | 17 | 74 | 44 | 16 | 36,76 | ||||
| ALVEOGRAM | |||||||||
| P (mm) | 60 | 100 | 78 | 8 | 10,67 | ||||
| L (mm) | 58 | 116 | 87 | 13 | 14,56 | ||||
| W Joules x 10-4 | 216 | 260 | 233 | 11 | 4,86 | ||||
| P / L | 0,52 | 1,72 | 0,90 | 0,25 | 27,84 | ||||
| These results were elaborated with 26 composite samples prepared proportionally from 429 primary samples (farmer deliveries) | |||||||||
SUBREGION DATA
In this sub region the wheat production was 1.828.280 tons., the 9,4% of the national total. Were sampled 85.000 tons., the 4,6% of the sub region production.| APPENDIX OF LOCALITY COMPOSITE SAMPLES | |||||||||||||
| SAMPLE IDENTIFICATION | WHEAT ANALYSIS | ||||||||||||
| SAMPLE NUMBER | LOCALITY, DISTRICT OR DEPARTMENT | TONNAJE | GRADE | TEST WEIGT (Kg/hl) |
TOTAL DAMAGED KERNELS (%) | FOREIGN MATERIAL (%) |
SHRUNKEN AND BROKEN KERNELS (%) | YELLOW BERRY KERNELS (%) |
PROTEIN (MOISTURE 13,5 % H°) (%) |
PROTEIN (dry basis) (%) |
WEIGT OF 1000 KERNELS (g) |
ASH (dry basis) (%) | |
| 301 | Paraná | 4000 | 1 | 81,40 | 0,18 | 0,06 | 0,33 | 3,00 | 9,7 | 11,2 | 38,40 | 1,640 | |
| 302 | Paraná | 4000 | 2 | 80,60 | 0,61 | 0,28 | 0,49 | 4,50 | 9,8 | 11,3 | 39,50 | 1,380 | |
| 303 | Paraná | 4000 | 1 | 79,20 | 0,75 | 0,07 | 0,33 | 3,80 | 10,2 | 11,8 | 40,00 | 1,400 | |
| 304 | Paraná | 4000 | 1 | 79,00 | 0,74 | 0,08 | 0,36 | 3,40 | 10,2 | 11,8 | 37,80 | 1,420 | |
| 305 | Federal | 1000 | 2 | 80,80 | 0,18 | 0,04 | 0,64 | 3,00 | 10,5 | 12,1 | 37,70 | 1,420 | |
| 306 | Villaguay | 3000 | 1 | 79,90 | 0,66 | 0,04 | 0,34 | 5,90 | 10,1 | 11,7 | 39,30 | 1,460 | |
| 307 | Diamante | 4000 | 2 | 81,80 | 1,06 | 0,07 | 0,58 | 9,90 | 10,0 | 11,6 | 39,30 | 1,570 | |
| 308 | Diamante | 4000 | 2 | 79,80 | 0,96 | 016 | 0,68 | 12,00 | 10,1 | 11,7 | 38,90 | 1,650 | |
| 309 | Diamante | 2000 | 2 | 79,60 | 1,82 | 0,36 | 0,48 | 6,80 | 9,8 | 11,3 | 38,70 | 1,630 | |
| 310 | Concordia | 1000 | 1 | 79,30 | 0,40 | 0,10 | 0,40 | 12,00 | 9,5 | 11,0 | 36,40 | 1,670 | |
| 311 | La Paz | 4000 | 1 | 81,00 | 0,38 | 0,11 | 0,22 | 2,00 | 10,0 | 11,6 | 38,30 | 1,860 | |
| 312 | Tala | 4000 | 2 | 79,70 | 0,80 | 0,09 | 0,59 | 8,80 | 10,2 | 11,8 | 36,60 | 1,820 | |
| 313 |
| 4000 | 2 | 79,70 | 0,77 | 0,44 | 0,37 | 1,20 | 9,8 | 11,3 | 37,10 | 1,500 | |
| 314 | Gualeguay | 2000 | 2 | 79,60 | 0,33 | 0,22 | 0,36 | 2,80 | 10,3 | 11,9 | 36,90 | 1,480 | |
| 315 |
| 4000 | 2 | 78,50 | 1,40 | 0,20 | 0,24 | 3,10 | 10,0 | 11,6 | 37,60 | 1,490 | |
| 316 |
| 4000 | 2 | 79,40 | 1,31 | 0,21 | 0,42 | 2,00 | 10,1 | 11,7 | 36,40 | 1,610 | |
| 317 |
| 4000 | 2 | 78,20 | 0,89 | 0,09 | 0,52 | 4,40 | 9,9 | 11,4 | 35,40 | 1,470 | |
| 318 |
| 4000 | 2 | 80,20 | 1,33 | 0,35 | 0,51 | 3,95 | 10,3 | 11,9 | 39,50 | 1,310 | |
| 319 |
Nogoyá | 4000 | 2 | 80,00 | 2,00 | 0,12 | 0,28 | 7,20 | 9,7 | 11,2 | 38,70 | 1,340 | |
| 320 |
Nogoyá | 2000 | 1 | 79,00 | 0,80 | 0,05 | 0,32 | 3,40 | 10,1 | 11,7 | 38,30 | 1,590 | |
| 321 | Uruguay | 4000 | 2 | 78,20 | 0,69 | 0,24 | 0,45 | 6,90 | 9,8 | 11,3 | 36,90 | 1,650 | |
| 322 |
Uruguay | 4000 | 2 | 80,40 | 1,42 | 0,17 | 0,32 | 9,00 | 9,9 | 11,4 | 34,80 | 1,390 | |
| 323 | Victoria | 4000 | 2 | 79,70 | 1,26 | 0,06 | 0,24 | 4,20 | 10,3 | 11,9 | 39,70 | 1,810 | |
| 324 |
| 4000 | 2 | 78,80 | 0,74 | 0,06 | 0,18 | 8,40 | 10,6 | 12,3 | 38,30 | 1,740 | |
| 325 | Colón | 1000 | 1 | 80,00 | 0,55 | 0,07 | 0,36 | 1,20 | 9,9 | 11,4 | 34,80 | 1,760 | |
| 326 | San Salvador | 1000 | 1 | 80,50 | 0,51 | 0,18 | 0,24 | 3,90 | 10,4 | 12,0 | 40,20 | 1,650 | |
| APPENDIX OF LOCALITY COMPOSITE SAMPLES | |||||||||||||||
| SAMPLE IDENTIFICATION | FLOUR ANALYSIS | ||||||||||||||
| SAMPLE NUMBER | LOCALITY, DISTRICT OR DEPARTMENT | WET GLUTEN(%) | DRY GLUTEN(%) | FALLING NUMBER (sec.) | FLOUR YIELD(%) | FARINOGRAM | ALVEOGRAM | ASH(dry basis)(%) | |||||||
| % WA (14 % H°) | D. T. (min.) | STABILITY (min.) | DEGREE SOFTENING(12 min.) | P | L | W | P/L | ||||||||
| 301 | Paraná | 22,2 | 8,3 | 337 | 63,8 | 55,7 | 1,6 | 3,1 | 65 | 100 | 58 | 236 | 1,72 | 0,473 | |
| 302 | Paraná | 21,9 | 8,0 | 344 | 65,7 | 57,5 | 2,0 | 4,6 | 46 | 81 | 81 | 231 | 1,00 | 0,526 | |
| 303 | Paraná | 21,4 | 7,7 | 338 | 63,5 | 56,4 | 14,3 | 23,8 | 27 | 77 | 86 | 235 | 0,90 | 0,423 | |
| 304 | Paraná | 20,9 | 7,7 | 308 | 62,6 | 54,4 | 12,3 | 22,2 | 29 | 82 | 87 | 259 | 0,94 | 0,432 | |
| 305 | Federal | 25,3 | 9,1 | 330 | 64,20 | 55,4 | 8,0 | 12,7 | 56 | 60 | 16 | 219 | 0,52 | 0,449 | |
| 306 | Villaguay | 22,8 | 8,2 | 368 | 63,30 | 56,4 | 9,2 | 14,7 | 50 | 68 | 106 | 227 | 0,64 | 0,442 | |
| 307 | Diamante | 20,2 | 7,7 | 340 | 64,70 | 55,8 | 10,6 | 19,6 | 33 | 80 | 76 | 219 | 1,05 | 0,505 | |
| 308 | Diamante | 23,3 | 8,5 | 302 | 64,50 | 56,5 | 1,9 | 2,5 | 65 | 88 | 72 | 240 | 1,22 | 0,432 | |
| 309 | Diamante | 20,9 | 7,4 | 317 | 62,20 | 56,4 | 1,7 | 1,9 | 74 | 84 | 68 | 216 | 1,24 | 0,372 | |
| 310 | Concordia | 20,4 | 7,6 | 340 | 62,90 | 56,6 | 2,9 | 2,1 | 60 | 86 | 80 | 241 | 1,08 | 0,534 | |
| 311 | La Paz | 24,2 | 8,9 | 354 | 64,60 | 57,4 | 2,0 | 15,0 | 28 | 82 | 86 | 251 | 0,95 | 0,490 | |
| 312 | Tala | 22,5 | 8,2 | 322 | 62,10 | 54,7 | 2,0 | 3,5 | 44 | 92 | 65 | 240 | 1,42 | 0,391 | |
| 313 | Gualeguay | 21,9 | 8,1 | 313 | 65,00 | 53,9 | 12,7 | 22,9 | 25 | 70 | 99 | 232 | 0,71 | 0,322 | |
| 314 | Gualeguay | 21,8 | 7,9 | 350 | 63,40 | 52,8 | 14,4 | 23,4 | 26 | 70 | 83 | 217 | 0,84 | 0,436 | |
| 315 | Gualeguaychu | 20,1 | 7,3 | 342 | 64,50 | 55,1 | 1,8 | 26,0 | 64 | 78 | 82 | 233 | 0,95 | 0,424 | |
| 316 | Gualeguaychu | 22,9 | 8,4 | 351 | 64,40 | 57,2 | 1,9 | 2,4 | 56 | 81 | 77 | 230 | 1,05 | 0,550 | |
| 317 | Gualeguaychu | 20,2 | 6,8 | 393 | 64,00 | 55,1 | 1,7 | 2,7 | 55 | 70 | 95 | 230 | 0,74 | 0,556 | |
| 318 | Nogoyá | 23,7 | 8,5 | 372 | 65,50 | 55,5 | 8,2 | 14,3 | 46 | 74 | 96 | 225 | 0,77 | 0,389 | |
| 319 | Nogoyá | 18,3 | 6,7 | 328 | 63,20 | 54,2 | 11,6 | 23,5 | 24 | 73 | 92 | 231 | 0,79 | 0,322 | |
| 320 | Nogoyá | 22,0 | 8,0 | 398 | 64,30 | 54,9 | 1,8 | 2,7 | 59 | 66 | 98 | 223 | 0,67 | 0,491 | |
| 321 | Uruguay | 21,0 | 7,6 | 343 | 64,40 | 55,1 | 1,8 | 3,1 | 51 | 77 | 84 | 237 | 0,92 | 0,405 | |
| 322 | Uruguay | 21,1 | 7,6 | 352 | 65,30 | 54,5 | 13,5 | 25,5 | 19 | 74 | 87 | 231 | 0,85 | 0,364 | |
| 323 | Victoria | 23,5 | 8,2 | 335 | 66,00 | 55,4 | 7,6 | 22,5 | 17 | 78 | 91 | 242 | 0,86 | 0,487 | |
| 324 | Victoria | 24,2 | 8,6 | 351 | 65,20 | 55,8 | 11,1 | 21,3 | 30 | 79 | 99 | 260 | 0,80 | 0,513 | |
| 325 | Colón | 22,0 | 8,0 | 386 | 64,10 | 57,0 | 1,7 | 2,6 | 61 | 75 | 94 | 242 | 0,80 | 0,524 | |
| 326 | San Salvador | 22,4 | 8,1 | 358 | 62,80 | 54,8 | 9,7 | 17,8 | 39 | 73 | 91 | 223 | 0,80 | 0,395 | |