


 SUBREGION NOA
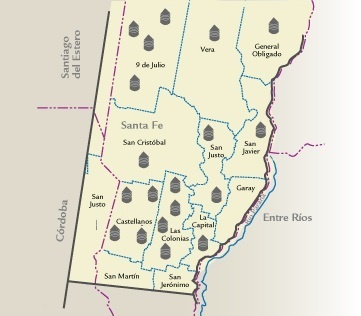
| | MAP OF THE SUBREGION |
 |
| |||||||||||||||||||||||||||||||||||||||||||||||||||||||||||||||||||||||
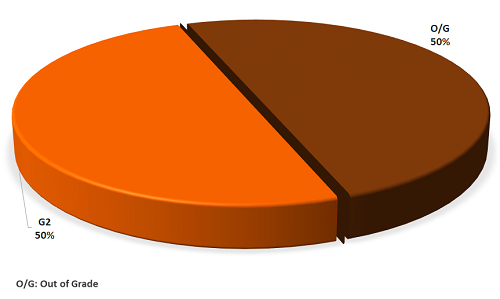
| | GRADE DISTRIBUTION |
|
| FLOUR ANALYSIS |
PARAMETERS | MINIMUM | MAXIMUM | AVERAGE | STANDARD DEVIATION | VARIATION COEFFICIENT | |||
| MILLING | Wet Gluten (%) | 22,6 | 28,2 | 25,5 | 2,3 | 9,11 | |||
| Dry Gluten (%) | 8,4 | 10,8 | 9,5 | 0,9 | 9,88 | ||||
| Falling Number (s) | 150 | 369 | 247 | 78 | 31,37 | ||||
| Flour Yield (%) | 68,40 | 70,00 | 69,27 | 0,51 | 0,73% | ||||
| Ash (dry basis) (%) | 0,650 | 0,736 | 0,698 | 0,033 | 4,70 | ||||
| FARINOGRAM | Water Absorption (14%H°)(%) | 58,0 | 65,7 | 61,7 | 3,0 | 4,89 | |||
| Development Time (min.) | 2,0 | 6,6 | 4,0 | 1,5 | 36,54 | ||||
| Stability (min.) | 2,0 | 15,5 | 7,8 | 4,4 | 56,74 | ||||
| Degree of Softening(12 min.) | 32 | 149 | 84 | 39 | 46,49 | ||||
| ALVEOGRAM | |||||||||
| P (mm) | 60 | 156 | 115 | 32 | 27,87 | ||||
| L (mm) | 37 | 97 | 60 | 19 | 32,28 | ||||
| W Joules x 10-4 | 181 | 287 | 247 | 33 | 13,37 | ||||
| P / L | 0,62 | 4,22 | 1,91 | 1,23 | 64,68 | ||||
| These results were elaborated with 6 composite samples prepared proportionally from 32 primary samples (farmer deliveries) | |||||||||
SUBREGION DATA
In this sub region the wheat production was 505.958 tons., the 2,6 % of the national total. Were sampled 24.000 tons., the 4,7% of the sub region production.| APPENDIX OF LOCALITY COMPOSITE SAMPLES | |||||||||||||
| SAMPLE IDENTIFICATION | WHEAT ANALYSIS | ||||||||||||
| SAMPLE NUMBER | LOCALITY, DISTRICT OR DEPARTMENT | TONNAJE | GRADE | TEST WEIGT (Kg/hl) |
TOTAL DAMAGED KERNELS (%) | FOREIGN MATERIAL (%) |
SHRUNKEN AND BROKEN KERNELS (%) | YELLOW BERRY KERNELS (%) |
PROTEIN (MOISTURE 13,5 % H°) (%) |
PROTEIN (dry basis) (%) |
WEIGT OF 1000 KERNELS (g) |
ASH (dry basis) (%) | |
| 3 |
| 4000 | F/E (3) | 77,50 | 2,77 | 1,98 | 0,29 | 2,39 | 11,9 | 13,8 | 31,36 | 1,941 | |
| 4 | 4000 | F/E (3) | 77,10 | 0,48 | 2,17 | 0,46 | 1,65 | 10,6 | 12,3 | 33,05 | 1,941 | ||
| 5 | 4000 | 3 | 80,40 | 0,90 | 0,89 | 0,40 | 2,60 | 11,4 | 13,2 | 34,52 | 2,092 | ||
| 6 | 4000 | 2 | 80,50 | 0,93 | 0,64 | 0,65 | 3,06 | 11,7 | 13,5 | 33,85 | 1,699 | ||
| 7 | 4000 | F/E (3) | 78,20 | 11,14 | 0,50 | 0,79 | 1,79 | 12,7 | 14,6 | 32,37 | 1,814 | ||
| 8 | 4000 | F/E | 81,00 | 6,32 | 0,32 | 0,38 | 2,82 | 12 | 13,9 | 33,28 | 1,861 | ||
| APPENDIX OF LOCALITY COMPOSITE SAMPLES | |||||||||||||||
| SAMPLE IDENTIFICATION | FLOUR ANALYSIS | ||||||||||||||
| SAMPLE NUMBER | LOCALITY, DISTRICT OR DEPARTMENT | WET GLUTEN(%) | DRY GLUTEN(%) | FALLING NUMBER (sec.) | FLOUR YIELD(%) | FARINOGRAM | ALVEOGRAM | ASH(dry basis)(%) | |||||||
| % WA (14 % H°) | D. T. (min.) | STABILITY (min.) | DEGREE SOFTENING(12 min.) | P | L | W | P/L | ||||||||
| 3 | Salta | 24,4 | 9,0 | 260 | 68,90 | 65,7 | 4,0 | 6,3 | 79 | 151 | 42 | 270 | 3,60 | 0722 | |
| 4 | Salta | 22,9 | 8,5 | 369 | 69,50 | 58 | 4,9 | 15,5 | 32 | 108 | 57 | 244 | 1,89 | 0,650 | |
| 5 | Salta | 22,6 | 8,4 | 291 | 68,40 | 65,1 | 3,5 | 6,1 | 63 | 156 | 37 | 254 | 4,22 | 0,724 | |
| 6 | Salta | 26,7 | 9,9 | 263 | 70,00 | 60,7 | 6,6 | 11,5 | 61 | 112 | 66 | 287 | 1,70 | 0,660 | |
| 7 | Tucumán | 28,2 | 10,5 | 150 | 69,50 | 62,6 | 2 | 2,0 | 149 | 104 | 63 | 246 | 1,65 | 0,696 | |
| 8 | Tucumán | 28,2 | 10,8 | 150 | 69,30 | 58,3 | 3 | 5,4 | 118 | 60 | 97 | 181 | 0,62 | 0,736 | |