


 SUBREGION NOA
In this season, the producers had little incentives for sowing. As a result of the scarce water stored in soil profiles due to a strong and long draught during summer and a part of autumn, many producers decided not to sow wheat.
Although April presented rains, they were not enough for sowing; therefore, only nearly the half of the area was sown, according to the zones. Some departments virtually did not plant wheat. Many crops were lost due to lack of moisture and, in general, it was a very difficult season.
As a consequence of little incentives for sowing wheat, many producers looked for more profitable productions, and in this sense chickpea crop was selected and its area was significantly increased. The few wheat planted crops reached flowering with almost no water in soil, therefore yields were very low, erratic and in some cases with no harvest at all.
As every year, there were presence of diseases such as Yellow Spot (Drechslera tritici repentis) and little Leaf Rust (Puccinia triticina Erikss).
There were some aphids, thrips and mites, mainly due to drought environmental.
In general, only few crops reached yields around 1000 kg/ha; and coincided with the early planted ones, in late April. The rest had very erratic results, with very low yields. However, baking quality was good to very good, with very acceptable levels of gluten and test weights.
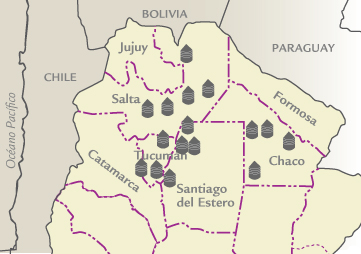
| MAP OF THE SUBREGION |
|
| ||||||||||||||||||||||||||||||||||||||||||||||||||||||||||||||||||||||
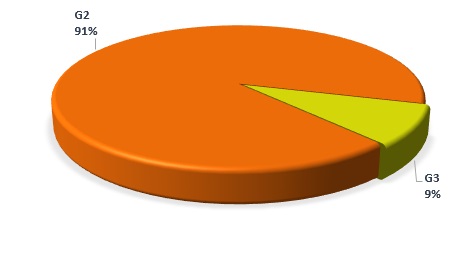
| GRADE DISTRIBUTION |
|
| FLOUR ANALYSIS | PARAMETERS | MINIMUM | MAXIMUM | AVERAGE | STANDARD DEVIATION | VARIATION COEFFICIENT | |||
| MILLING | Wet Gluten (%) | 26,9 | 37,9 | 32,7 | 3,0 | 9,05 | |||
| Dry Gluten (%) | 10,0 | 14,0 | 12,1 | 1,1 | 8,95 | ||||
| Falling Number (sec.) | 393 | 451 | 421 | 15 | 3,60 | ||||
| Flour Yield(%) | 62,9 | 71,1 | 69,0 | 2,4 | 3,46 | ||||
| Ash (dry basis) (%) | 0,571 | 0,822 | 0,731 | 0,060 | 8,22 | ||||
| FARINOGRAM | Water Absorption(14 % H°) (%) | 61,2 | 64,0 | 62,1 | 0,8 | 1,24 | |||
| Development Time (min.) | 6,2 | 12,9 | 9,5 | 1,9 | 20,08 | ||||
| Stability (min.) | 5,9 | 16,3 | 11,5 | 3,1 | 27,44 | ||||
| Degree of Softening (12 min.) | 50 | 101 | 66 | 15 | 22,30 | ||||
| P (mm) | 78 | 109 | 94 | 10 | 10,19 | ||||
| ALVEOGRAM | |||||||||
| L (mm) | 61 | 120 | 93 | 15 | 16,44 | ||||
| W Joules x 10-4 | 211 | 376 | 289 | 42 | 14,64 | ||||
| P / L | 0,69 | 1,67 | 1,01 | 0,28 | 26,51 | ||||
| These results were elaborated with 11 composite samples prepared proportionally from 93 primary samples (farmer deliveries) | |||||||||
SUBREGION DATA
In this sub region the wheat production was 388,987 tons., the 4.7% of the national total. Were sampled 44,000 tons., the 11.31% of the sub region production.
| APPENDIX OF LOCALITY COMPOSITE SAMPLES | |||||||||||||
| SAMPLE IDENTIFICATION | WHEAT ANALYSIS | ||||||||||||
| SAMPLE NUMBER | LOCALITY, DISTRICT OR DEPARTMENT | TONNAJE | GRADE | TEST WEIGT (Kg/hl) | TOTAL DAMAGED KERNELS(%) | FOREIGN MATERIAL (%) |
SHRUNKEN AND BROKEN KERNELS (%) | YELLOW BERRY KERNELS (%) |
PROTEIN MOISTURE 13,5 % H°) |
PROTEIN (s/S.S.S.) |
WEIGT OF 1000 KERNELS (gr.) | ASH(dry basis) % | |
| 1 | Burruyacú/Cruz Alta/Leales | 4000 | 2 | 81,25 | 0,44 | 0,62 | 0,50 | 1,42 | 12,8 | 15,6 | 31,48 | 1,857 | |
| 2 | La Cocha/Granero | 4000 | 2 | 81,05 | 0,06 | 0,80 | 0,52 | 1,38 | 12,1 | 30,72 | 30,72 | 1,846 | |
| 3 | Dto. Jimenez | 4000 | 2 | 80,60 | 0,20 | 0,76 | 0,70 | 0,56 | 13,5 | 16,0 | 29,32 | 1,990 | |
| 4 | Dto. Jimenez | 4000 | 2 | 81,25 | 0,20 | 0,64 | 1,10 | 0,00 | 13,8 | 30,16 | 30,16 | 1,924 | |
| 5 | Dto. Pellegrini | 4000 | 3 | 80,80 | 0,18 | 0,82 | 0,62 | 1,22 | 12,9 | 30,36 | 30,36 | 1,925 | |
| 6 | Robles/Guasayán | 4000 | 2 | 78,15 | 0,10 | 0,68 | 1,12 | 1,42 | 12,8 | 30,36 | 27,08 | 1,996 | |
| 7 | Anta | 4000 | 2 | 83,05 | 0,10 | 0,57 | 0,53 | 1,58 | 13,2 | 30,97 | 30,97 | 1,952 | |
| 8 | Anta | 4000 | 2 | 80,60 | 0,23 | 0,67 | 0,53 | 12,3 | 12,9 | 31,31 | 31,31 | 2,011 | |
| 9 | Orán | 4000 | 2 | 82,40 | 0,20 | 0,80 | 0,26 | 0,00 | 12,9 | 30,36 | 32,60 | 2,012 | |
| 10 | Metán | 4000 | 2 | 82,15 | 0,18 | 0,82 | 0,62 | 1,22 | 12,9 | 30,36 | 30,36 | 1,925 | |
| 11 | Cerrillos | 4000 | 2 | 80,35 | 0,02 | 0,76 | 0,50 | 3,22 | 11,6 | 30,36 | 33,30 | 1,846 | |
| APPENDIX OF LOCALITY COMPOSITE SAMPLES | |||||||||||||||
| SAMPLE IDENTIFICATION | FLOUR ANALYSIS | ||||||||||||||
| SAMPLE NUMBER |
LOCALITY, DISTRICT OR DEPARTMENT | WET GLUTEN(%) | DRY GLUTEN(%) | FALLING NUMBER (sec.) | FLOUR YIELD(%) | FARINOGRAM | ALVEOGRAM | ASH(dry basis)(%) | |||||||
| D. T. (min.) | STABILITY (min.) | DEGREE SOFTENING(12 min.) | P | L | W | P/L | |||||||||
| 1 | Pampa del Infierno | 30,7 | 11,4 | 475 | 68,8 | 60,4 | 10,3 | 17,4 | 43 | 102 | 79 | 295 | 1,29 | 0,842 | |
| 2 | Pampa del Infierno | 35,2 | 13,0 | 475 | 68,2 | 60,9 | 11,3 | 15,9 | 57 | 101 | 89 | 318 | 1,13 | 0,950 | |
| 3 | Roque Saens Peña | 32,5 | 12,0 | 403 | 71,1 | 61,2 | 12,8 | 19,4 | 45 | 11,4 | 78 | 331 | 1,46 | 0,819 | |
| 4 | Hermoso Campo | 30,5 | 11,3 | 436 | 71,0 | 60,3 | 10,9 | 17,3 | 44 | 125 | 78 | 354 | 1,60 | 0,818 | |
| 5 | Dto. Alberdi | 32,6 | 12,1 | 414 | 71,3 | 63,2 | 7,9 | 7,7 | 80 | 90 | 99 | 293 | 0,91 | 0,775 | |