


 SUBREGION II SOUTH
The planted area had a significant decrease in relation to the historical average. Part of it was occupied by other winter crops, especially barley, or lands have been left fallow during winter for summer sowing.
The reasons for a significant decrease in the sown surface were mainly caused by internal trade limitations, low profitability of the producers and the unfavorable weather conditions, as a consequence of the "El Niño" phenomenon during the crop cycle, resulting in a lower production of wheat.
Sowing dates were in the months of June and July. Varieties of long and short cycle were used, although there was a slight trend towards the long cycles.
Phosphate fertilization was done during the sowing and nitrogen fertilization in the sowing or during the sowing-tillering period.
During winter, the wheat developed with excellent humidity conditions and in certain cases with significant hydric excesses. As from mid-September, beginning of stalking, there was adecquate hydric availability. Around the time of earing-flowering (first half of October) rains were abundant, with cloudy days and little heliophany, which influenced negatively in yields. The excessive humidity generated diseases such as Yellow Spot (Dreschlera tritici-repentis) and Leaf Septoriosis (Septoria tritici).
During stalking and earing, some attacks of Leaf Rust (Puccinia triticina) and Bacterian Spot (complex Pseudomona syringae and Xantonomas translucens) were observed.
At flowering, climate conditions were favorable for the attack of Ear Fusarium (Fusarium graminearum); a significant incidence and severity was observed in those materials with early flowering, and the severity diminished in relation to the delay in the stalking date.
There was a presence of leaf and ear aphids, with intensity in some crops; and chemical treatments were done.
During November, at grain filling period, it also rained; and towards the end of the crop cycle, at the maturation and harvesting time, some occasional rains together with strong winds delayed the harvest. Shattering and washed grains by rains were observed.
The quality of grains was highly affected by Ear Fusarium and by the excess of rains during grain filling and harvest periods.
Test weights were medium to low, as well as the weight of thousand seeds. Yields were low, the average of the sub region was 3,000 kg/ha.
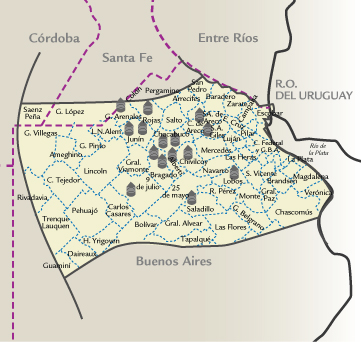
| MAP OF THE SUBREGION |
|
| |||||||||||||||||||||||||||||||||||||||||||||||||||||||||||||||||||||
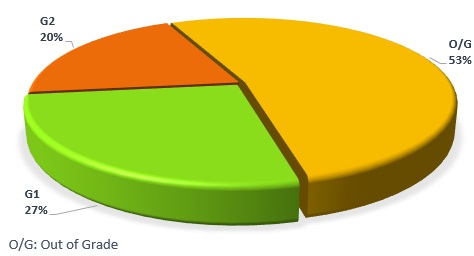
| GRADE DISTRIBUTION |
|
| FLOUR ANALYSIS | PARAMETERS | MINIMUM | MAXIMUM | AVERAGE | STANDARD DEVIATION | VARIATION COEFFICIENT | |||
| MILLING | Wet Gluten (%) | 23,8 | 35,1 | 28,3 | 3,2 | 11,37 | |||
| Dry Gluten (%) | 8,8 | 13,0 | 10,5 | 1,2 | 11,47 | ||||
| Falling Number (seg.) | 373 | 489 | 426 | 34 | 7,92 | ||||
| Flour Yield (%) | 69,6 | 74,6 | 72,3 | 1,6 | 2,23 | ||||
| Ash (dry basis) (%) | 1,648 | 2,069 | 1,885 | 0,119 | 6,31 | ||||
| FARINOGRAM | Water Absorption (14% H°) (%) | 54,4 | 60,7 | 57,2 | 1,9 | 3,33 | |||
| Development Time (min.) | 1,6 | 10,0 | 5,2 | 2,6 | 49,48 | ||||
| Stability (min.) | 2,8 | 13,0 | 8,9 | 3,3 | 37,50 | ||||
| Degree of Softening (12 min.) | 58 | 116 | 75 | 15 | 20,06 | ||||
| P (mm) | 58 | 92 | 73 | 10 | 13,37 | ||||
| ALVEOGRAM | |||||||||
| L (mm) | 59 | 111 | 85 | 12 | 14,26 | ||||
| W Joules x 10-4 | 155 | 286 | 210 | 35 | 16,86 | ||||
| P / L | 0,60 | 1,41 | 0,86 | 0,21 | 23,44 | ||||
| These results were elaborated with 15 composite samples prepared proportionally from 156 primary samples (farmer deliveries) | |||||||||
SUBREGION DATA
In this sub region the wheat production was 979.012 tons., the 11,8% of the national total. Were sampled 53,000 tons., the 5.41% of the sub region production.
| APPENDIX OF LOCALITY COMPOSITE SAMPLES | |||||||||||||
| SAMPLE IDENTIFICATION | WHEAT ANALYSIS | ||||||||||||
| SAMPLE NUMBER | LOCALITY, DISTRICT OR DEPARTMENT | TONNAJE | GRADE | TEST WEIGT (Kg/hl) | TOTAL DAMAGED KERNELS(%) | FOREIGN MATERIAL (%) |
SHRUNKEN AND BROKEN KERNELS
(%) | YELLOW BERRY KERNELS (%) |
PROTEIN (MOISTURE 13,5 % H°) |
PROTEIN (s/S.S.S.) | WEIGT OF 1000 KERNELS | ASH(dry basis) % | |
| 200 | Chacabuco | 4000 | F/E | 71,20 | 0,94 | 0,10 | 0,60 | 2,18 | 11,3 | 13,1 | 31,26 | 1,863 | |
| 201 | Chacabuco | 4000 | F/E | 69,60 | 0,98 | 0,28 | 1,20 | 1,34 | 11,1 | 12,8 | 29,32 | 1,929 | |
| 202 | Carmen de Areco | 2000 | F/E | 67,80 | 0,70 | 0,34 | 0,58 | 0,00 | 12,2 | 14,1 | 27,74 | 1,943 | |
| 203 | Junín | 4000 | 2 | 76,35 | 1,18 | 0,50 | 0,46 | 0,90 | 13,6 | 15,7 | 32,01 | 2,041 | |
| 204 | Junín | 4000 | 2 | 76,35 | 0,68 | 0,28 | 0,70 | 0,42 | 12,1 | 14,0 | 31,67 | 2,069 | |
| 205 | Gral. Arenales | 4000 | 3 | 73,65 | 1,40 | 0,46 | 1,64 | 1,60 | 11,8 | 13,6 | 27,72 | 1,905 | |
| 206 | San Andrés de Giles | 400070 | F/E | 69,15 | 1,70 | 0,20 | 0,54 | 0,00 | 10,8 | 12,5 | 28,99 | 1,925 | |
| 207 | Rojas | 4000 | F/E | 72,75 | 0,58 | 0,36 | 0,70 | 0,64 | 13,5 | 15,6 | 31,11 | 2,037 | |
| 208 | Alberti | 4000 | 3 | 73,65 | 1,32 | 0,24 | 0,48 | 0,00 | 12,8 | 14,8 | 32,52 | 1,856 | |
| 209 | Bragado | 4000 | F/E | 70,95 | 0,83 | 0,46 | 0,74 | 0,00 | 11,1 | 12,8 | 28,42 | 1,843 | |
| 210 |
| 2000 | F/E | 70,95 | 0,70 | 0,24 | 0,82 | 0,00 | 11,1 | 12,8 | 33,52 | 1,823 | |
| 211 |
| 4000 | F/E | 72,75 | 1,20 | 0,32 | 0,64 | 0,00 | 11,2 | 12,9 | 30,76 | 1,839 | |
| 212 |
| 2000 | 3 | 75,20 | 1,58 | 0,26 | 1,46 | 1,70 | 11,1 | 12,8 | 32,83 | 1,742 | |
| 213 |
| 3000 | 3 | 75,65 | 1,20 | 0,42 | 0,52 | 4,90 | 10,6 | 12,3 | 34,26 | 1,648 | |
| 214 |
| 4000 | 2 | 76,35 | 0,95 | 0,32 | 0,48 | 3,16 | 10,6 | 12,3 | 33,02 | 1,682 | |
| APPENDIX OF LOCALITY COMPOSITE SAMPLES | |||||||||||||||
| SAMPLE IDENTIFICATION | WHEAT ANALYSIS | ||||||||||||||
| SAMPLE NUMBER | LOCALITY, DISTRICT OR DEPARTMENT | WET GLUTEN(%) | DRY GLUTEN(%) | FALLING NUMBER (SEG.) | FLOUR YIELD(%) | FARINOGRAM | ALVEOGRAM | ASH(dry basis)(%) | |||||||
| % AA (14 % H°) | T, D, (MIN.) | STABILITY (MIN.) | DEGREE SOFTENING(12 MIN.) | P | L | W | P/ | ||||||||
| 200 | Chacabuco | 27,4 | 10,1 | 420 | 73,7 | 57,0 | 1,6 | 3,1 | 73 | 61 | 86 | 174 | 0,71 | 1,863 | |
| 201 | Chacabuco | 27,0 | 10,0 | 420 | 71,7 | 56,5 | 1,7 | 3,4 | 72 | 61 | 79 | 170 | 0,70 | 0,929 | |
| 202 | Carmen de Areco | 25,6 | 9,5 | 489 | 72,4 | 59,0 | 4,9 | 10,5 | 58 | 72 | 111 | 260 | 0,65 | 1,943 | |
| 203 | Junín | 35,1 | 13,0 | 474 | 71,9 | 60,7 | 7,8 | 13,0 | 62 | 86 | 100 | 286 | 0,86 | 2,041 | |
| 204 | Junín | 34,0 | 12,6 | 413 | 72,0 | 60,1 | 10,0 | 11,0 | 116 | 92 | 80 | 248 | 1,15 | 2,069 | |
| 205 | Gral. Arenales | 28,6 | 10,6 | 434 | 74,6 | 57,5 | 4,6 | 9,7 | 69 | 70 | 91 | 208 | 0,77 | 0,905 | |
| 206 | San Andrés de Giles | 25,2 | 9,3 | 435 | 70,8 | 54,4 | 4,5 | 10,5 | 61 | 73 | 70 | 185 | 1,04 | 1,925 | |
| 207 | Rojas | 31,5 | 11,7 | 392 | 70,0 | 58,8 | 7,5 | 11,0 | 91 | 72 | 98 | 240 | 0,73 | 2,037 | |
| 208 | Alberti | 28,9 | 10,7 | 376 | 73,6 | 58,5 | 7,9 | 11,7 | 87 | 77 | 86 | 230 | 0,90 | 1,856 | |
| 209 | Bragado | 27,3 | 10,1 | 407 | 70,6 | 54,4 | 5,1 | 9,9 | 74 | 58 | 96 | 180 | 0,60 | 0,843 | |
| 210 |
| 25,5 | 9,4 | 435 | 73,7 | 56,3 | 3,8 | 7,5 | 93 | 64 | 75 | 155 | 0,85 | 1,823 | |
| 211 |
| 23,8 | 8,8 | 488 | 69,6 | 55,8 | 1,7 | 2,8 | 72 | 83 | 59 | 191 | 2,41 | 1,839 | |
| 212 |
| 25,6 | 9,5 | 447 | 73,3 | 57,6 | 3,4 | 8,4 | 62 | 83 | 78 | 224 | 1,06 | 0,742 | |
| 213 |
| 28,5 | 10,6 | 449 | 74,5 | 56,7 | 7,1 | 11,6 | 65 | 73 | 83 | 206 | 0,88 | 1,648 | |
| 214 |
| 26,5 | 9,8 | 373 | 73,6 | 55,6 | 4,6 | 10,1 | 67 | 71 | 83 | 191 | 0,86 | 1,682 | |