


 SUBREGION NEA
Crops begun in mid-May with difficulties in the sowing of long-cycle wheat due to the lack of rains and low water reserves in soil profiles, since the previous season presented one of the most significant droughts in the agricultural history of the province; extending itself up to the first days of July, the sowing time for short-cycle crops. Therefore, planted area was significantly reduced, with respect to the two previous season.
Tillering stage was developed with scarce moisture conditions due to the lack of rains to recharge the soil profile, that mainly affected long cycle cultivares. The first and practically only significant rainfall during the crop cycle were registered between late August and early September, being late for the long-cycle cultivares, that were at flag leaf to flowering stages; but they did allowed the short-cycle cultivars, that already were at tilling stages, to develop the reproductive stage with a moisture content in the soil profile that allowed in some cases acceptable yields.
Harvest begun in mid-October, with some long cycle crops, and there were some delays due to drizzles that persisted for several days. Labors extended until mid-November, with better weather conditions and more acceptable yields.
With respect to plagues, some prevalence was registered of aphids and thrips, severe in some cases. There was no record of leaf diseases with significant damages.
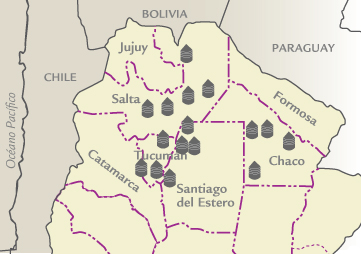
In Chaco, one of the two province of this region, only 31,170 ha were harvested on 48,270 ha planted, with a produce of 31,121 tons, and an average yield of 1000 kg/ha, with extremes of 300 to 2,200 kg/ha, which is not far from the normal parameters for the region. The 17,100 ha losed were mainly due to draught, and in some cases to hail and frosts.
| MAP OF THE SUBREGION |
|
| ||||||||||||||||||||||||||||||||||||||||||||||||||||||||||||||||||||||
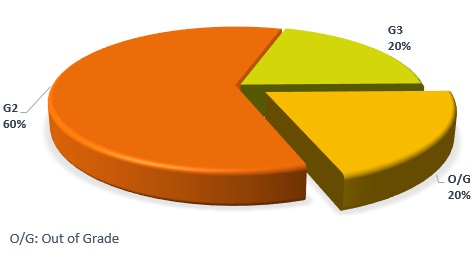
| GRADE DISTRIBUTION |
|
| FLOUR ANALYSIS | PARAMETERS | MINIMUM | MAXIMUM | AVERAGE | STANDARD DEVIATION | VARIATION COEFFICIENT | |||
| MILLING | Wet Gluten (%) | 30,5 | 35,2 | 32,3 | 1,7 | 5,24 | |||
| Dry Gluten (%) | 11,3 | 13,0 | 12,0 | 0,6 | 5,09 | ||||
| Falling Number (sec.) | 403 | 475 | 441 | 30 | 6,82 | ||||
| Flour Yield(%) | 68,2 | 71,3 | 70,1 | 1,3 | 1,86 | ||||
| Ash (dry basis) (%) | 0,775 | 0,950 | 0,841 | 0,059 | 6,99 | ||||
| FARINOGRAM | Water Absorption(14 % H°) (%) | 60,3 | 63,2 | 61,2 | 1,1 | 1,72 | |||
| Development Time (min.) | 7,9 | 12,8 | 10,6 | 1,6 | 15,03 | ||||
| Stability (min.) | 7,7 | 19,4 | 15,5 | 4,1 | 26,23 | ||||
| Degree of Softening (12 min.) | 43 | 80 | 54 | 14 | 26,11 | ||||
| P (mm) | 90 | 125 | 106 | 12 | 11,29 | ||||
| ALVEOGRAM | |||||||||
| L (mm) | 78 | 99 | 85 | 8 | 9,82 | ||||
| W Joules x 10-4 | 293 | 354 | 318 | 23 | 7,19 | ||||
| P / L | 0,91 | 1,60 | 1,26 | 0,24 | 18,98 | ||||
| These results were elaborated with 5 composite samples prepared proportionally from 38 primary samples (farmer deliveries) | |||||||||
SUBREGION DATA
In this sub region the wheat production was 155,615 tons., the 1.9% of the national total.Were sampled 20,000 tons., the 12.85% of the sub region production.
| APPENDIX OF LOCALITY COMPOSITE SAMPLES | |||||||||||||
| SAMPLE IDENTIFICATION | WHEAT ANALYSIS | ||||||||||||
| SAMPLE NUMBER | LOCALITY, DISTRICT OR DEPARTMENT | TONNAJE | GRADE | TEST WEIGT (Kg/hl) | TOTAL DAMAGED KERNELS(%) | FOREIGN MATERIAL (%) |
SHRUNKEN AND BROKEN KERNELS (%) | YELLOW BERRY KERNELS(%) | PROTEIN (MOISTURE 13,5 % H°) |
PROTEIN (s/S.S.S.) | WEIGT OF 1000 KERNELS (gr.) | ASH(dry basis)(%) | |
| 1 | Pampa del Infierno | 4000 | 2 | 80,80 | 0,30 | 0,68 | 0,42 | 2,54 | 13,5 | 15,6 | 31,29 | 2,173 | |
| 2 | Pampa del Infierno | 4000 | 2 | 79,45 | 0,08 | 0,84 | 1,08 | 2,18 | 13,0 | 15,0 | 29,97 | 2,265 | |
| 3 | Roque Saenz Peña | 4000 | F/E | 78,35 | 0,11 | 0,48 | 2,80 | 0,94 | 13,8 | 16,0 | 28,71 | 2,258 | |
| 4 | Hermoso Campo | 4000 | 3 | 78,35 | 0,28 | 1,00 | 1,04 | 0,00 | 13,0 | 15,0 | 29,80 | 2,169 | |
| 5 | Dto. Alberdi | 4000 | 2 | 80,80 | 0,04 | 0,44 | 0,00 | 0,62 | 14,4 | 16,6 | 29,11 | 1,943 | |
| APPENDIX OF LOCALITY COMPOSITE SAMPLES | |||||||||||||||
| SAMPLE IDENTIFICATION | FLOUR ANALYSIS | ||||||||||||||
| SAMPLE NUMBER | LOCALITY, DISTRICT OR DEPARTMENT | WET GLUTEN (%) | DRY GLUTEN(%) | FALLING NUMBER (sec.) | FLOUR YIELD(%) | FARINOGRAM | ALVEOGRAM | ASH(dry basis)(%) | |||||||
| % AA (14 % H°) | T, D, (min.) | STABILITY (min.) | DEGREE SOFTENING(12 min.) | P | L | W | P/L | ||||||||
| 1 | Pampa del Infierno | 30,7 | 11,4 | 475 | 68,8 | 60,4 | 10,3 | 17,4 | 43 | 102 | 79 | 295 | 1,29 | 0,842 | |
| 2 | Pampa del Infierno | 35,2 | 13,0 | 475 | 68,2 | 60,9 | 11,3 | 15,9 | 57 | 101 | 89 | 318 | 1,13 | 0,950 | |
| 3 | Roque Saens Peña | 32,5 | 12,0 | 403 | 71,1 | 61,2 | 12,8 | 19,4 | 45 | 11,4 | 78 | 331 | 1,46 | 0,819 | |
| 4 | Hermoso Campo | 30,5 | 11,3 | 436 | 71,0 | 60,3 | 10,9 | 17,3 | 44 | 125 | 78 | 354 | 1,60 | 0,818 | |
| 5 | Dto. Alberdi | 32,6 | 12,1 | 414 | 71,3 | 63,2 | 7,9 | 7,7 | 80 | 90 | 99 | 293 | 0,91 | 0,775 | |