


 SUBREGION NEA
Moisture within the soil profile was good; planting started mid May and continued to mid June as rains delayed the summer crops harvest. Short cycle varieties were planted until end of July.
Tillering occurred under good moisture but with high temperatures that induced a rapid growth.
Late frosts occurred in the reproductive stage and affected long cycle varieties, mainly. On the other hand, drought and high temperatures negatively affected short cycle varieties. The combination of no rain and high temperatures (up to 35°C) accelerated maturity and affected grain final weight, resulting in plots in regular conditions by the end of cycle.
Aphids and trips incidence was severe in some cases. No significant damage from foliar diseases was observed.
Harvest started beginning of October and extended until the end of the month, with some interruptions caused by rain, early in November. Early planted plots, exception made of those affected by late frost, gave the best yields. Late planted plots suffered a marked drop in yields due to lack of moisture.
43,180 ha were harvested; total production was 39,966 tons with an average yield of 930 kg/ha. Yields ranged from 400 to 1,700 kg/ha, which correspond to historical values. Drought and frosts led to the loss of 2,300 ha; a small fraction was slightly affected by hail.
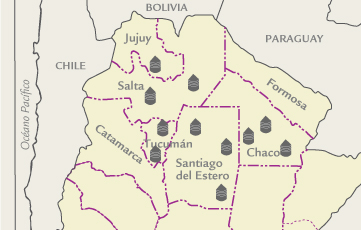
| MAP OF THE SUBREGION |
|
| ||||||||||||||||||||||||||||||||||||||||||||||||||||||||||||||||||||||
| GRADE DISTRIBUTION |
|
| FLOUR ANALYSIS | PARAMETERS | MINIMUM | MAXIMUM | AVERAGE | STANDARD DEVIATION | VARIATION COEFFICIENT | |||
| MILLING | Wet Gluten (%) | 30,2 | 33,9 | 32,1 | 1,3 | 3,96 | |||
| Dry Gluten (%) | 11,2 | 12,6 | 11,9 | 0,5 | 3,94 | ||||
| Falling Number (sec.) | 405 | 455 | 420 | 19 | 4,49 | ||||
| Flour Yield(% | 70,5 | 72,8 | 71,6 | 0,8 | 1,05 | ||||
| Ash (dry basis) (%) | 0,544 | 0,743 | 0,676 | 0,072 | 10,67 | ||||
| FARINOGRAM | Water Absorption(14 % H°) (%) | 56,8 | 58,9 | 57,6 | 0,8 | 1,37 | |||
| Development Time (min.) | 7,9 | 20,0 | 14,7 | 4,7 | 31,88 | ||||
| Stability (min.) | 14,7 | 29,2 | 23,5 | 5,8 | 24,84 | ||||
| Degree of Softening (12 min.) | 17 | 44 | 32 | 10 | 31,88 | ||||
| P (mm) | 103 | 128 | 111 | 9 | 8,32 | ||||
| ALVEOGRAM | |||||||||
| L (mm) | 64 | 88 | 78 | 8 | 10,35 | ||||
| W Joules x 10-4 | 311 | 349 | 331 | 13 | 3,96 | ||||
| P / L | 1,20 | 2,00 | 1,43 | 0,29 | 19,94 | ||||
| These results were elaborated with 5 composite samples prepared proportionally from 91 primary samples (farmer deliveries). | |||||||||
SUBREGION DATA
In this sub region the wheat production was 110.650 tons., the 0,8 % of the national total. Were sampled 20.000 tons., the 18,1% of the sub region production.
| APPENDIX OF LOCALITY COMPOSITE SAMPLES | |||||||||||||
| SAMPLE IDENTIFICATION | WHEAT ANALYSIS | ||||||||||||
| SAMPLE NUMBER | LOCALITY, DISTRICT OR DEPARTMENT | TONNAJE | GRADE | TEST WEIGT (Kg/hl) | TOTAL DAMAGED KERNELS(%) | FOREIGN MATERIAL (%) |
SHRUNKEN AND BROKEN KERNELS
(%) | YELLOW BERRY KERNELS (%) |
PROTEIN (MOISTURE 13,5 % H°) |
PROTEIN (s/S.S.S.) | WEIGT OF 1000 KERNELS (gr.) | ASH(dry basis) % | |
| 1 | Alte.Brown-Independencia-Maípu | 4000 | 2 | 80,60 | 0,60 | 0,14 | 0,76 | 1,54 | 11,8 | 13,6 | 31,03 | 2,107 | |
| 2 | 9 de Julio-O´Higgins-Fontana | 4000 | 2 | 79,45 | 1,70 | 0,20 | 1,10 | 1,26 | 11,8 | 13,6 | 29,41 | 2,019 | |
| 3 | Chaco | 4000 | 2 | 82,15 | 0,74 | 0,18 | 1,18 | 2,80 | 11,8 | 13,6 | 29,32 | 2,171 | |
| 4 | Sgo. del Estero-Bandera-Selva | 4000 | 2 | 83,50 | 0,24 | 0,08 | 0,84 | 0,30 | 11,8 | 13,7 | 28,28 | 1,996 | |
| 5 | Sgo.del Estero-Quimilí | 4000 | 2 | 83,50 | 0,50 | 0,10 | 0,88 | 1,08 | 11,8 | 13,6 | 29,03 | 1,795 | |
| APPENDIX OF LOCALITY COMPOSITE SAMPLES | |||||||||||||||
| SAMPLE IDENTIFICATION | WHEAT ANALYSIS | ||||||||||||||
| SAMPLE NUMBER | LOCALITY, DISTRICT OR DEPARTMENT | WET GLUTEN(%) | DRY GLUTEN(%) | FALLING NUMBER (sec.) | FLOUR YIELD(%) | FARINOGRAM | ALVEOGRAM | ASH(dry basis)(%) | |||||||
| % WA (14% H°) | T, D, (min.) | STABILITY (min.) | DEGREE SOFTENING(12 min.) | P | L | W | P/L | ||||||||
| 1 | Alte.Brown-Independencia-Maipú | 31,3 | 11,6 | 405 | 70,5 | 58,9 | 13,5 | 18,5 | 44 | 105 | 83 | 322 | 1,27 | 0,728 | |
| 2 | 9 de Julio-O´Higgins-Fontana- | 32,6 | 12,1 | 455 | 71,6 | 58,0 | 12,2 | 26,1 | 17 | 115 | 76 | 335 | 1,51 | 0,743 | |
| 3 | Chaco | 30,2 | 11,2 | 411 | 71,6 | 56,8 | 7,9 | 14,7 | 43 | 103 | 79 | 311 | 1,30 | 0,658 | |
| 4 | Sgo. del Estero-Bandera-Selva | 33,9 | 12,6 | 405 | 71,5 | 56,8 | 20,0 | 28,8 | 31 | 106 | 88 | 349 | 1,20 | 0,544 | |
| 5 | Sgo.del Estero-Quimilí | 32,8 | 12,1 | 425 | 72,8 | 57,6 | 20,0 | 29,2 | 26 | 128 | 64 | 337 | 2,00 | 0,709 | |