


 SUBREGION NEA
Planting started by the end of May. Planting was at its peak by the second half of June under good soil moisture and continued until early July in some areas.
Weather conditions were varied, with occasional rains and some frosts. Early-planted wheat suffered the attack of caterpillars. Late cultivars suffered the attack of trips in the early stages of growth.
Most varieties showed no difficulties in the reproduction stage. Temperatures were mild, there was some water deficit at flowering, especially in long-cycle cultivars with the resulting effect on yield.
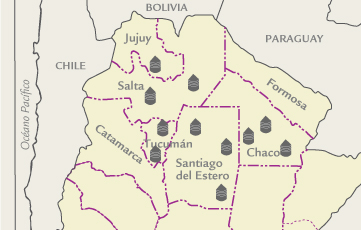
Harvest started mid-October. Some areas were affected by rains and excessive soil moisture. Yields were uneven but acceptable. In regions where water availability was enough and technology was properly used, yields were 3,200 kg/ha, but if the water was insufficient and technology was disregarded, yields were 1,100 kg/ha. Average yield in the province of Chaco was approximately 1,400 kg/ha.
| MAP OF THE SUBREGION |
|
| ||||||||||||||||||||||||||||||||||||||||||||||||||||||||||||||||||||||
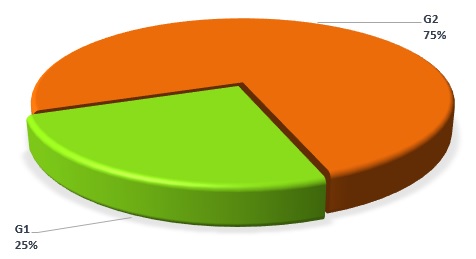
| GRADE DISTRIBUTION |
|
| FLOUR ANALYSIS | PARAMETERS | MINIMUM | MAXIMUM | AVERAGE | STANDARD DEVIATION | VARIATION COEFFICIENT | |||
| MILLING | Wet Gluten (%) | 26,0 | 28,5 | 27,1 | 1,1 | 4,48 | |||
| Dry Gluten (%) | 9,6 | 10,6 | 10,0 | 0,5 | 4,63 | ||||
| Falling Number (seg.) | 366 | 453 | 412 | 36 | 8,83 | ||||
| Flour Yield (%) | 59,5 | 59,8 | 59,6 | 0,1 | 0,24 | ||||
| Ash (dry basis) (%) | 0,598 | 0,744 | 0,654 | 0,064 | 9,80 | ||||
| FARINOGRAM | Water Absorption (14 % H°) (%) | 53,5 | 58,1 | 55,9 | 2,6 | 4,60 | |||
| Development Time(min.) | 13,3 | 18,4 | 16,1 | 2,4 | 14,75 | ||||
| Stability (min.) | 19,6 | 28,5 | 24,6 | 3,8 | 15,28 | ||||
| Degree of Softening (12 min.) | 19 | 35 | 27 | 7 | 24,87 | ||||
| P (mm) | 83 | 132 | 100 | 23 | 22,70 | ||||
| ALVEOGRAM | |||||||||
| L (mm) | 64 | 83 | 74 | 9 | 11,68 | ||||
| W Joules x 10-4 | 242 | 346 | 292 | 47 | 16,03 | ||||
| P / L | 1,06 | 2,06 | 1,36 | 0,46 | 33,59 | ||||
| These results were elaborated with 4 composite samples prepared proportionally from 36 primary samples. | |||||||||
SUBREGION DATA
In this sub region the wheat production was 381.793 tons., the 2.1% of the national total. Were sampled 14.000 tons., the 3.7% of the sub region production.
| APPENDIX OF LOCALITY COMPOSITE SAMPLES | |||||||||||||
| SAMPLE IDENTIFICATION | WHEAT ANALYSIS | ||||||||||||
| SAMPLE NUMBER | LOCALITY, DISTRICT OR DEPARTMENT | TONNAJE | GRADE | TEST WEIGT (Kg/hl) | TOTAL DAMAGED KERNELS(%) | FOREIGN MATERIAL (%) | SHRUNKEN AND BROKEN KERNELS(%) | YELLOW BERRY KERNELS (%) | PROTEIN(MOISTURE 13,5 % H°) | PROTEIN(s/S.S.S.) | WEIGT OF 1000 KERNELS (gr.) | ASH(dry basis) % | |
| 1 | Chaco | 4000 | 2 | 77,90 | 0,38 | 0,18 | 0,11 | 3,76 | 12,4 | 14,3 | 31,17 | 2,092 | |
| 2 | Chaco | 4000 | 2 | 78,35 | 0,22 | 0,24 | 0,58 | 1,64 | 12,5 | 14,5 | 30,61 | 2,017 | |
| 3 | Chaco | 4000 | 2 | 77,25 | 0,88 | 0,18 | 0,54 | 2,19 | 12,4 | 14,3 | 34,48 | 2,081 | |
| 7 | Sgo. del Estero | 2000 | 1 | 81,70 | 0,02 | 0,08 | 0,04 | 1,34 | 11,8 | 13,6 | 40,05 | 1,897 | |
| APPENDIX OF LOCALITY COMPOSITE SAMPLES | |||||||||||||||
| SAMPLE IDENTIFICATION | FLOUR ANALYSIS | ||||||||||||||
| SAMPLE NUMBER | LOCALITY, DISTRICT OR DEPARTMENT | WET GLUTEN(%) | DRY GLUTEN(%) | FALLING NUMBER (seg.) | FLOUR YIELD(%) | FARINOGRAM | ALVEOGRAM | ASH(dry basis)(%) | |||||||
| % WA (14 % H°) | D. T. (min.) | STABILITY (min.) | DEGREE SOFTENING (12 min.) | P | L | W | P/L | ||||||||
| 1 | Chaco | 26,0 | 9,6 | 405 | 59,8 | 53,8 | 14,9 | 24,2 | 28 | 85 | 69 | 242 | 1,23 | 0,654 | |
| 2 | Chaco | 26,1 | 9,7 | 453 | 59,5 | 53,5 | 17,6 | 28,5 | 19 | 83 | 78 | 266 | 1,06 | 0,598 | |
| 3 | Chaco | 27,6 | 10,2 | 366 | 59,6 | 58,1 | 18,4 | 26,0 | 25 | 132 | 64 | 346 | 2,06 | 0,744 | |
| 7 | Sgo.del Estero | 28,5 | 10,6 | 423 | 59,5 | 58,1 | 13,3 | 19,6 | 35 | 99 | 83 | 314 | 1,19 | 0,621 | |