


 SUBREGION NEA
In the campaign 2011 the abundant rains occurred towards the end of summer caused delayed in the sowing by excess moisture in the soil profile, affecting the planting of long cycles and concentrated between mid June and beginning of July, with planting short cycles.
At tillering and to the end of the vegetative stage, the water and temperature conditions were normal for that environment. But in the reproductive stage, mainly some 20 to 30 days before anthesis, the period when the number of grains is determined, the water deficit was significant, in addition to late frosts in September that caused the loss of more advanced lots. Rains normalized during the stage of grain filling, towards the end of September and beginning of October.
The tendency of monthly average temperature was similar to the historical series, reaching in average the 15.5° C during the stage of the grain number definition. Furthermore, there were short periods of 2 to 3 days with high temperature amplitude reaching and surpassing the 27ºC to 30º C of average maximum temperature and low temperatures registered during the night.
The sanitary condition of the crop was generally good, although in some areas there was high incidence of yellow spot (Drechslera tritici-repentis), but low incidence of leaf rust (Puccinia triticina). stem rust (Puccinia graminis) was also observed in several genotypes. As pests, there sometimes severe incidence of aphids and thrips.
Yields dropped by 30 - 35 % as regard the prior campaign. The lack of rains during the period of grain number definition was the main environmental factor affecting the crop, and therefore the production.
The hectares that were lost due to frost and hail in few cases.
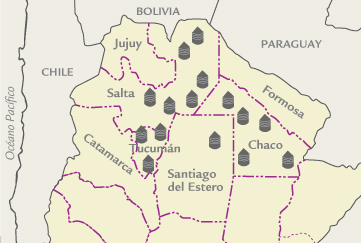
| MAP OF THE SUBREGION |
|
| ||||||||||||||||||||||||||||||||||||||||||||||||||||||||||||||||||||||
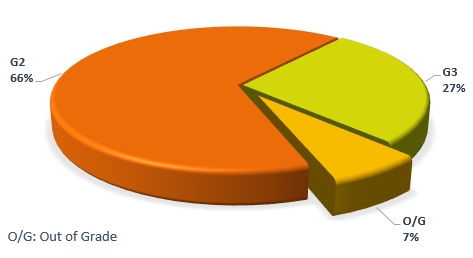
| GRADE DISTRIBUTION |
|
| FLOUR ANALYSIS | PARAMETERS | MINIMUM | MAXIMUM | AVERAGE | STANDARD DEVIATION | VARIATION COEFFICIENT | |||
| MILLING | Wet Gluten (%) | 21,6 | 29,2 | 25,9 | 2,4 | 9,25 | |||
| Dry Gluten (%) | 7,9 | 11,0 | 9,2 | 1,0 | 10,57 | ||||
| Falling Number (seg.) | 411 | 512 | 445 | 31 | 6,86 | ||||
| Flour Yield(%) | 67,5 | 72,5 | 70,1 | 1,6 | 2,26 | ||||
| Ash (dry basis) (%) | 0,561 | 0,795 | 0,722 | 0,063 | 8,69 | ||||
| FARINOGRAM | Water Absorption(14 % H°) (%) | 54,7 | 62,5 | 59,3 | 2,1 | 3,60 | |||
| Development Time (min.) | 7,9 | 27,2 | 13,8 | 5,0 | 36,28 | ||||
| Stability (min.) | 11,0 | 45,2 | 20,8 | 8,8 | 42,26 | ||||
| Degree of Softening (12 min.) | 12 | 67 | 41 | 15 | 35,97 | ||||
| P (mm) | 100 | 156 | 117 | 15 | 13,14 | ||||
| ALVEOGRAM | |||||||||
| L (mm) | 50 | 945 | 749 | 16 | 21,67 | ||||
| W Joules x 10-4 | 252 | 393 | 315 | 36 | 11,53 | ||||
| P / L | 1,12 | 3,12 | 1,59 | 0,63 | 36,66 | ||||
| These results were elaborated with 15 composite samples prepared proportionally from 198 primary samples (farmer deliveries). | |||||||||
SUBREGION DATA
In this sub region the wheat production was 1,092,980 tons., the 8.4% of the national total. Were sampled 60,180 tons., the 5.5% of the sub region production.
| APPENDIX OF LOCALITY COMPOSITE SAMPLES | |||||||||||||
| SAMPLE IDENTIFICATION | WHEAT ANALYSIS | ||||||||||||
| SAMPLE NUMBER | LOCALITY, DISTRICT OR DEPARTMENT | TONNAJE | GRADE | TEST WEIGT (Kg/hl) | TOTAL DAMAGED KERNELS(%) | FOREIGN MATERIAL (%) |
SHRUNKEN AND BROKEN KERNELS
(%) | YELLOW BERRY KERNELS(%) | PROTEIN (MOISTURE 13,5 % H°) |
PROTEIN (s/S.S.S.) | WEIGT OF 1000 KERNELS (gr.) | ASH(dry basis)(%) | |
| 14 | Chaco | 3750 | 3 | 75,10 | 0,50 | 0,42 | 0,62 | 0,00 | 12,1 | 14,2 | 29,80 | 2,089 | |
| 15 | Chaco | 4020 | 2 | 78,10 | 0,56 | 0,24 | 0,82 | 0,00 | 11,4 | 13,2 | 32,10 | 2,031 | |
| 16 | Chaco | 3980 | 2 | 78,10 | 0,20 | 0,12 | 0,40 | 0,00 | 11,4 | 13,2 | 27,60 | 2,037 | |
| 17 | Chaco | 4210 | 3 | 75,70 | 0,58 | 0,66 | 1,46 | 0,00 | 12,8 | 14,8 | 28,80 | 2,123 | |
| 18 | Chaco | 3900 | 2 | 77,10 | 0,12 | 0,14 | 0,90 | 0,00 | 11,1 | 12,8 | 30,10 | 2,017 | |
| 19 | Santiago del Estero | 4320 | 2 | 76,00 | 0,54 | 0,08 | 0,74 | 0,00 | 12,4 | 14,3 | 30,00 | 2,039 | |
| 1 | Burruyacú | 4000 | 2 | 81,05 | 0,20 | 0,52 | 1,04 | 0,56 | 11,7 | 13,5 | 28,72 | 1,864 | |
| 2 | Cruz Alta / Leales | 4000 | 2 | 83,05 | 0,08 | 0,18 | 0,88 | 3,10 | 11,9 | 13,8 | 29,86 | 1,818 | |
| 3 | La Cocha / Simoca | 4000 | 2 | 81,70 | 0,08 | 0,16 | 0,74 | 1,04 | 12,2 | 14,1 | 31,49 | 1,959 | |
| 4 | Anta | 4000 | 2 | 82,60 | 0,32 | 0,36 | 0,56 | 9,08 | 11,8 | 13,6 | 28,03 | 2,035 | |
| 5 |
| 4000 | 3 | 81,25 | 0,08 | 1,16 | 0,40 | 10,76 | 11,2 | 12,9 | 29,04 | 2,024 | |
| 5 |
| 4000 | 3 | 81,25 | 0,08 | 1,16 | 0,40 | 10,76 | 11,2 | 12,9 | 29,04 | 2,024 | |
| 6 |
| 4000 | 2 | 81,25 | 0,22 | 0,68 | 0,40 | 4,76 | 11,8 | 13,6 | 28,16 | 2,087 | |
| 7 |
| 4000 | F/E | 79,45 | 0,08 | 1,96 | 0,44 | 3,24 | 10,6 | 12,3 | 33,10 | 2,079 | |
| 8 |
| 4000 | 3 | 79,90 | 0,04 | 1,04 | 0,32 | 6,36 | 10,8 | 12,5 | 33,59 | 2,061 | |
| 9 |
| 4000 | 2 | 81,70 | 0,12 | 0,52 | 0,36 | 2,76 | 9,8 | 11,3 | 31,84 | 2,063 | |
| APPENDIX OF LOCALITY COMPOSITE SAMPLES | |||||||||||||||
| SAMPLE IDENTIFICATION | FLOUR ANALYSIS | ||||||||||||||
| SAMPLE NUMBER | LOCALITY, DISTRICT OR DEPARTMENT | WET GLUTEN (%) | DRY GLUTEN(%) | FALLING NUMBER (sec.) | FLOUR YIELD(%) | FARINOGRAM | ALVEOGRAM | ASH(dry basis)(%) | |||||||
| % WA (14 % H°) | D. T.(min.) | STABILITY (min.) | DEGREE SOFTENING(12 min.) | P | L | W | P/L | ||||||||
| 14 | Chaco | 27,6 | 9,5 | 436 | 70,3 | 57,8 | 10,5 | 20,4 | 32 | 100 | 88 | 321 | 1,14 | 0,705 | |
| 15 | Chaco | 24,3 | 8,1 | 440 | 68,0 | 61,1 | 11,1 | 16,8 | 42 | 124 | 71 | 333 | 1,75 | 0,715 | |
| 16 | Chaco | 23,0 | 7,9 | 489 | 70,8 | 54,7 | 27,2 | 45,2 | 12 | 113 | 57 | 277 | 1,98 | 0,705 | |
| 17 | Chaco | 26,9 | 8,9 | 502 | 71,6 | 58,3 | 13,3 | 25,1 | 25 | 103 | 80 | 323 | 1,29 | 0,795 | |
| 18 | Chaco | 24,5 | 8,3 | 512 | 70,3 | 56,1 | 9,6 | 20,9 | 30 | 112 | 53 | 252 | 2,11 | 0,785 | |
| 19 | Santiago del Estero | 29,1 | 9,9 | 441 | 72,5 | 60,7 | 7,9 | 12,0 | 56 | 106 | 848 | 304 | 1,26 | 0,785 | |
| 1 | Burruyacú | 29,2 | 11,0 | 425 | 71,8 | 61,3 | 8,8 | 11,0 | 67 | 103 | 92 | 308 | 1,12 | 0,733 | |
| 2 | Cruz Alta / Leales | 28,0 | 10,3 | 411 | 72,0 | 62,3 | 11,3 | 14,6 | 48 | 114 | 76 | 303 | 1,50 | 0,691 | |
| 3 | La Cocha / Simoca | 27,6 | 10,3 | 453 | 70,4 | 59,6 | 10,6 | 13,6 | 52 | 102 | 80 | 284 | 1,28 | 0,561 | |
| 4 | Anta | 27,3 | 10,2 | 431 | 70,4 | 59,7 | 15,8 | 19,8 | 45 | 117 | 93 | 390 | 1,26 | 0,780 | |
| 5 | Anta | 23,4 | 8,5 | 447 | 69,7 | 59,9 | 16,3 | 21,9 | 41 | 156 | 50 | 328 | 3,12 | 0,756 | |
| 6 | Anta | 26,5 | 9,9 | 421 | 70,5 | 59,9 | 16,3 | 20,5 | 48 | 115 | 94 | 393 | 1,22 | 0,695 | |
| 7 | Orán | 22,3 | 8,2 | 414 | 67,5 | 57,5 | 20,0 | 33,1 | 21 | 138 | 53 | 303 | 2,60 | 0,665 | |
| 8 | Orán | 21,6 | 8,1 | 431 | 67,9 | 58,1 | 17,9 | 25,7 | 32 | 138 | 50 | 288 | 2,76 | 0,790 | |
| 9 | Cerrillos / Metán | 26,4 | 9,7 | 420 | 67,7 | 62,5 | 10,4 | 11,7 | 58 | 113 | 81 | 311 | 1,40 | 0,654 | |