


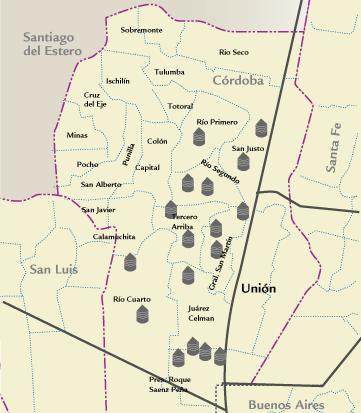
 SUBREGION V NORTH
Compared with 2013/2014, more acres were planted. Planting started beginning of May and ended early in July.
Moisture within the soil profile was good, crop developed properly at tillering and booting, with a good number of tillers, adequate foliar coverage and crop uniformity.
Frost damaged the crop at flowering, which added to the water stress caused by temperatures above-average. All in all, yields were lower at harvest.
Compared with 2013/2014, higher doses of fertilizers were required at planting; the same happened with second fertilization at tillering.
Grain quality was not very good, test weight was also low.
Protein and gluten content ranged from regular to good, depending on the area.
| MAP OF THE SUBREGION |
|
| |||||||||||||||||||||||||||||||||||||||||||||||||||||||||||||||||||||
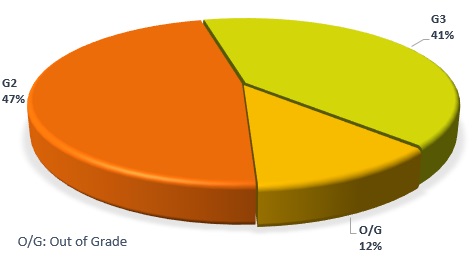
| GRADE DISTRIBUTION |
|
| FLOUR ANALYSIS | PARAMETERS | MINIMUM | MAXIMUM | AVERAGE | STANDARD DEVIATION | VARIATION COEFFICIENT | |||
| MILLING | Wet Gluten (%) | 20,2 | 29,3 | 25,3 | 2,4 | 9,52 | |||
| Dry Gluten (%) | 7,5 | 10,9 | 9,4 | 0,9 | 9,62 | ||||
| Falling Number (seg.) | 315 | 437 | 383 | 35 | 9,24 | ||||
| Flour Yield (%) | 69,6 | 74,8 | 71,6 | 1,5 | 2,16 | ||||
| Ash (dry basis) (%) | 0,540 | 0,783 | 0,663 | 0,063 | 9,47 | ||||
| FARINOGRAM | Water Absorption(14 % H°) (%) | 54,9 | 58,8 | 57,1 | 1,0 | 1,68 | |||
| Development Time (min.) | 1,5 | 8,1 | 3,0 | 1,8 | 58,94 | ||||
| Stability (min.) | 1,7 | 19,4 | 8,8 | 4,0 | 45,54 | ||||
| Degree of Softening (12 min.) | 27 | 89 | 50 | 14 | 28,62 | ||||
| P (mm) | 62 | 101 | 87 | 10 | 11,72 | ||||
| ALVEOGRAM | |||||||||
| L (mm) | 55 | 123 | 91 | 17 | 18,77 | ||||
| W Joules x 10-4 | 208 | 302 | 261 | 25 | 9,55 | ||||
| P / L | 0,53 | 1,84 | 0,98 | 0,31 | 30,50 | ||||
| These results were elaborated with 17 composite samples prepared proportionally from 180 primary samples (farmer deliveries). | |||||||||
SUBREGION DATA
In this sub region the wheat production was 1.881.430 tons., the 13,6 % of the national total. Were sampled 74.838 tons., the 3,98% of the sub region production.
| APPENDIX OF LOCALITY COMPOSITE SAMPLES | |||||||||||||
| SAMPLE IDENTIFICATION | WHEAT ANALYSIS | ||||||||||||
| SAMPLE NUMBER | LOCALITY, DISTRICT OR DEPARTMENT | TONNAJE | GRADE | TEST WEIGT (Kg/hl) | TOTAL DAMAGED KERNELS(%) | FOREIGN MATERIAL(%) |
SHRUNKEN AND BROKEN KERNELS (%) | YELLOW BERRY KERNELS(%) |
PROTEIN (MOISTURE 13,5 % H°) |
PROTEIN (s/S.S.S.) | WEIGT OF 1000 KERNELS | ASH(dry basis)(%) | |
| 600 | San Justo | 3638 | 3 | 75,90 | 0,66 | 0,47 | 1,22 | 1,50 | 10,7 | 12.4 | 29,79 | 2,020 | |
| 601 | San Justo | 4700 | 2 | 79,00 | 0,90 | 0,28 | 0,95 | 4,90 | 9,3 | 10,8 | 32,36 | 1,780 | |
| 602 | Río Primero | 4000 | 2 | 79,00 | 0,53 | 0,38 | 0,81 | 4,90 | 10,0 | 11,6 | 31,06 | 1,690 | |
| 603 | Juárez Celman | 5000 | 2 | 77,45 | 0,39 | 0,26 | 0,63 | 0,00 | 12,5 | 14,5 | 34,04 | 1,610 | |
| 604 | Río Cuarto | 4000 | 3 | 79,25 | 0,32 | 0,40 | 1,43 | 0,30 | 12,0 | 13,9 | 29,46 | 1,870 | |
| 605 | Río Cuarto | 4000 | 2 | 77,45 | 0,62 | 0,48 | 0,65 | 0,00 | 12,5 | 14,5 | 32,63 | 1,680 | |
| 606 | R.Sáenz Peña | 5000 | 3 | 79,25 | 0,54 | 0,28 | 1,25 | 1,40 | 10,3 | 11,9 | 29,30 | 1,820 | |
| 607 | R.Sáenz Peña | 5000 | 2 | 79,00 | 0,47 | 0,21 | 0,51 | 4,40 | 10,2 | 11,8 | 32,02 | 1,840 | |
| 608 | R.Sáenz Peña | 5000 | 2 | 79,70 | 0,55 | 0,23 | 0,78 | 1,70 | 10,6 | 12,3 | 31,31 | 1,720 | |
| 609 | R.Sáenz Peña | 5000 | 2 | 79,70 | 0,56 | 0,13 | 1,00 | 1,10 | 10,8 | 12,5 | 33,96 | 1,720 | |
| 610 |
| 4000 | 3 | 77,00 | 0,55 | 0,18 | 1,38 | 4,80 | 10,9 | 12,6 | 28,24 | 2,040 | |
| 611 |
| 3900 | 3 | 78,15 | 0,57 | 0,46 | 1,61 | 1,30 | 11,2 | 12,9 | 28,75 | 1,990 | |
| 612 |
| 3600 | 3 | 78,35 | 0,27 | 0,15 | 1,44 | 2,10 | 11,4 | 13,2 | 28,43 | 1,860 | |
| 613 |
| 6000 | 2 | 79,00 | 0,81 | 0,27 | 1,11 | 4,20 | 10,3 | 11,9 | 30,67 | 1,880 | |
| 614 |
| 4500 | F/E | 76,65 | 0,57 | 0,38 | 2,46 | 2,10 | 11,3 | 13,1 | 24,42 | 1,910 | |
| 615 |
| 4400 | F/E | 79,00 | 0,39 | 0,21 | 2,10 | 4,10 | 11,9 | 12,6 | 28,57 | 1,920 | |
| 616 |
| 5100 | 3 | 78,60 | 0,47 | 0,32 | 1,79 | 2,80 | 10,9 | 12,6 | 27,63 | 1,880 | |
| APPENDIX OF LOCALITY COMPOSITE SAMPLES | |||||||||||||||
| SAMPLE IDENTIFICATION | WHEAT ANALYSIS | ||||||||||||||
| SAMPLE NUMBER | LOCALITY, DISTRICT OR DEPARTMENT | WET GLUTEN (%) | DRY GLUTEN(%) | FALLING NUMBER (SEG.) | FLOUR YIELD(%) | FARINOGRAM | ALVEOGRAM | ASH(dry basis)(%) | |||||||
| % AA (14 % H°) | T, D, (MIN.) | STABILITY (MIN.) | DEGREE SOFTENING(12 MIN.) | P | L | W | P/L | ||||||||
| 600 | San Justo | 25,4 | 9,4 | 403 | 69,8 | 55,6 | 2,1 | 3,9 | 50 | 90 | 77 | 261 | 1,17 | 0,613 | |
| 601 | San Justo | 21,5 | 8,0 | 385 | 69,7 | 56,3 | 1,5 | 89 | 101 | 55 | 221 | 55 | 1,84 | 0,649 | |
| 602 | Río Primero | 225 | 8,3 | 352 | 70,2 | 55,9 | 1,9 | 3,7 | 66 | 83 | 82 | 232 | 1,01 | 0,672 | |
| 603 | Juárez Celman | 26,8 | 9,9 | 322 | 74,8 | 57,8 | 5,8 | 11,1 | 56 | 77 | 117 | 276 | 0,66 | 0,630 | |
| 604 | Río Cuarto | 26,5 | 9,8 | 359 | 70,4 | 57,1 | 5,4 | 12,5 | 45 | 84 | 102 | 274 | 0,82 | 0,540 | |
| 605 | Río Cuarto | 25,2 | 9,3 | 379 | 72,5 | 58,8 | 5,7 | 8,1 | 63 | 72 | 123 | 259 | 0,59 | 0,646 | |
| 606 | R. Sáenz Peña | 26,9 | 10,0 | 315 | 70,4 | 57,4 | 2,0 | 7,3 | 45 | 99 | 76 | 277 | 1,30 | 0,613 | |
| 607 | R. Sáenz Peña | 23,4 | 8,7 | 368 | 73,8 | 56,8 | 1,9 | 4,4 | 63 | 94 | 73 | 241 | 129 | 0,689 | |
| 608 | R. Sáenz Peña | 22,3 | 8,2 | 365 | 71,4 | 56,1 | 2,1 | 9,2 | 40 | 78 | 86 | 229 | 0,91 | 0,540 | |
| 609 | R. Sáenz Peña | 25,8 | 9,5 | 403 | 72,1 | 57,5 | 2,4 | 10,1 | 44 | 84 | 100 | 265 | 0,84 | 0,711 | |
| 610 |
| 20,2 | 7,5 | 365 | 69,6 | 56,9 | 2,4 | 8,2 | 51 | 62 | 117 | 208 | 0,53 | 0,703 | |
| 611 |
| 27,2 | 10,1 | 437 | 71,4 | 57,8 | 2,5 | 15,4 | 28 | 97 | 83 | 280 | 1,17 | 0,783 | |
| 612 |
| 29,3 | 10,9 | 408 | 71,3 | 57,0 | 8,1 | 19,4 | 27 | 94 | 93 | 302 | 1,01 | 0,673 | |
| 613 |
| 25,9 | 9,6 | 398 | 73,9 | 58,0 | 2,0 | 7,2 | 48 | 91 | 87 | 266 | 1,05 | 0,752 | |
| 614 |
| 27,7 | 10,3 | 424 | 70,3 | 56,7 | 2,4 | 11,4 | 38 | 85 | 102 | 285 | 0,83 | 0,652 | |
| 615 |
| 28,0 | 10,4 | 432 | 72,1 | 58,5 | 2,1 | 8,2 | 45 | 100 | 83 | 288 | 1,20 | 0,708 | |
| 616 |
| 26,4 | 9,8 | 417 | 71,3 | 56,9 | 2,2 | 8,6 | 48 | 86 | 92 | 272 | 0,93 | 0,664 | |