


 SUBREGION V NORTH
The sown area was higher than 2012/13 campaign, surpassing the 500,000 has. Sowing during May and June was done with proper moisture in some departments; however, in others, moisture was scarce to assure proper germination.
From June until September inclusive, no rains were recorded or there were scarce rains. During the stages of growing and development, the crops underwent adverse climatic conditions with water and thermal stress, which resulted in plants with a smaller height than normal, fewer tillers per plant, thus resulting in fewer ears per plant fewer grains per ear.
Phenological stages of booting and flowering developed with no soil moisture in the root area, mainly affecting late sowings with intermediate and short-cycle varieties. Early sowing crops with long-cycle varieties, that were fertilized and had good initial moisture, were in better conditions.
Grain filling developed with drought, severe frosts in September, which resulted in few grains per ear and less weight thereof. Photo thermal coefficient ‘Q’ at earing did not exceed the value of one, which prevented obtaining high yields.
Yields were significantly lower than normal, not exceeding in some departments values between 400 and 800 kg/ha. Many lots were not harvested by considered uneconomical.
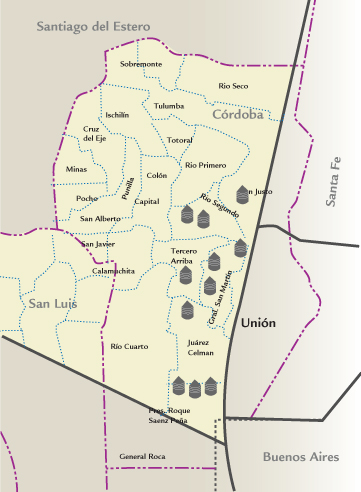
Conversely, crops with artificial watering yielded between 3500 and 4500 kg/ha. The rest of the sub region presented lower values, 1050 kg/ha in the department of Tercero Arriba, 770 kg/ha in the department of Río Segundo and 1600 kg/ha in the department of General San Martín. At the South of this latter department, in the zone of La Laguna, Etruria and Chazón, yields of 3000 kg/ha were obtained as a result of early sowing and excellent water supply.
| MAP OF THE SUBREGION |
|
| ||||||||||||||||||||||||||||||||||||||||||||||||||||||||||||||||||||||
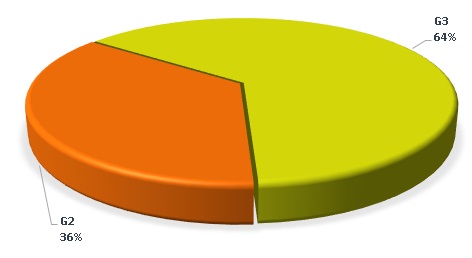
| GRADE DISTRIBUTION |
|
| FLOUR ANALYSIS | PARAMETERS | MINIMUM | MAXIMUM | AVERAGE | STANDARD DEVIATION | VARIATION COEFFICIENT | |||
| MILLING | Wet Gluten (%) | 30,9 | 40,3 | 34,7 | 2,8 | 0,08 | |||
| Dry Gluten (%) | 10,6 | 13,7 | 11,7 | 1,0 | 0,08 | ||||
| Falling Number (seg.) | 302 | 397 | 357 | 29 | 0,08 | ||||
| Flour Yield (%) | 68,2 | 72,9 | 70,4 | 1,6 | 0,02 | ||||
| Ash (dry basis) (%) | 0,667 | 0,906 | 0,785 | 0,068 | 0,09 | ||||
| FARINOGRAM | Water Absorption (14 % H°) (%) | 56,1 | 60,1 | 58,0 | 1,0 | 0,02 | |||
| Development Time (min.) | 4,8 | 8,4 | 6,6 | 1,3 | 0,19 | ||||
| Stability (min.) | 13,2 | 22,3 | 17,7 | 2,1 | 0,12 | ||||
| Degree of Softening (12 min.) | 25 | 43 | 32 | 4 | 0,14 | ||||
| P (mm) | 66 | 93 | 84 | 7 | 0,08 | ||||
| ALVEOGRAM | |||||||||
| L (mm) | 89 | 150 | 121 | 22 | 0,18 | ||||
| W Joules x 10-4 | 270 | 370 | 318 | 33 | 0,10 | ||||
| P / L | 0,45 | 1,04 | 0,69 | 0,19 | 0,27 | ||||
| These results were elaborated with 11 composite samples prepared proportionally from 192 primary samples (farmer deliveries). | |||||||||
SUBREGION DATA
In this sub region the wheat production was 603.280 tons., the 6,6 % of the national total. Were sampled 36.261 tons., the 6,01 % of the sub region production.
| APPENDIX OF LOCALITY COMPOSITE SAMPLES | |||||||||||||
| SAMPLE IDENTIFICATION | WHEAT ANALYSIS | ||||||||||||
| SAMPLE NUMBER | LOCALITY, DISTRICT OR DEPARTMENT | TONNAJE | GRADE | TEST WEIGT (Kg/hl) | TOTAL DAMAGED KERNELS(%) | FOREIGN MATERIAL (%) |
SHRUNKEN AND BROKEN KERNELS (%) | YELLOW BERRY KERNELS (%) |
PROTEIN (MOISTURE 13,5 % H°) |
PROTEIN (s/S.S.S.) | WEIGT OF 1000 KERNELS | ASH(dry basis) % | |
| 600 | Roque Sáenz Peña | 3500 | 2 | 79,25 | 1,11 | 0,02 | 0,91 | 0,40 | 12,3 | 14,2 | 30,76 | 1,980 | |
| 601 | Roque Sáenz Peña | 3500 | 2 | 79,25 | 0,72 | 0,02 | 0,64 | 0,70 | 11,7 | 13,5 | 30,24 | 2,000 | |
| 602 | Roque Sáenz Peña | 3000 | 2 | 77,70 | 0,83 | 0,03 | 0,90 | 0,30 | 12,8 | 14,8 | 30,21 | 2,000 | |
| 603 | General San Martín | 3400 | 3 | 76,35 | 2,40 | 0,31 | 1,66 | 0,00 | 11,6 | 13,4 | 27,73 | 2,010 | |
| 604 | General San Martín | 3300 | 3 | 76,10 | 2,63 | 0,30 | 1,49 | 0,20 | 13,5 | 15,6 | 27,46 | 2,040 | |
| 605 | General San Martín | 3150 | 3 | 75,20 | 1,52 | 0,21 | 1,16 | 0,20 | 12,8 | 14,8 | 27,98 | 2,020 | |
| 606 | Tercero Arriba | 4000 | 3 | 74,10 | 2,92 | 0,58 | 1,15 | 0,50 | 14,6 | 16,9 | 25,40 | 2,410 | |
| 607 | Río Segundo | 3000 | 3 | 74,50 | 2,86 | 0,03 | 2,05 | 0,30 | 13,0 | 15,0 | 25,11 | 2,360 | |
| 608 | Río Segundo | 3700 | 3 | 72,75 | 1,66 | 0,40 | 1,68 | 0,20 | 13,9 | 16,1 | 25,24 | 2,160 | |
| 609 | San Justo | 779 | 3 | 76,10 | 5,43 | 0,44 | 1,14 | 0,20 | 12,2 | 14,1 | 29,00 | 1,990 | |
| 610 |
| 4932 | 2 | 76,10 | 0,79 | 0,78 | 0,81 | 0,30 | 12,8 | 14,8 | 29,58 | 2,010 | |
| APPENDIX OF LOCALITY COMPOSITE SAMPLES | |||||||||||||||
| SAMPLE IDENTIFICATION | WHEAT ANALYSIS | ||||||||||||||
| SAMPLE NUMBER | LOCALITY, DISTRICT OR DEPARTMENT | WET GLUTEN(%) | DRY GLUTEN(%) | FALLING NUMBER (SEG.) | FLOUR YIELD(%) | FARINOGRAM | ALVEOGRAM | ASH(dry basis)(%) | |||||||
| % AA (14 % H°) | T, D, (MIN.) | STABILITY (MIN.) | DEGREE SOFTENING(12 MIN.) | P | L | W | P/L | ||||||||
| 600 | Roque Saenz Peña | 32,0 | 10,7 | 382 | 70,3 | 57,9 | 8,4 | 16,4 | 37 | 89 | 90 | 270 | 0,99 | 0,736 | |
| 601 | Roque Saenz Peña | 30,9 | 10,6 | 397 | 70,5 | 57,5 | 7,6 | 20,8 | 26 | 93 | 89 | 286 | 1,04 | 0,652 | |
| 602 | Roque Saenz Peña | 33,0 | 11,2 | 373 | 68,2 | 57,3 | 7,9 | 17,5 | 35 | 80 | 121 | 298 | 0,66 | 0,727 | |
| 603 | General San Martín | 32,0 | 10,7 | 333 | 72,7 | 57,2 | 5,7 | 18,6 | 25 | 91 | 90 | 289 | 1,01 | 0,667 | |
| 604 | General San Martín | 33,2 | 11,5 | 380 | 72,9 | 57,1 | 6,1 | 22,3 | 30 | 86 | 355 | 339 | 0,367 | 0,801 | |
| 605 | General San Martín | 35,9 | 11,8 | 366 | 70,4 | 57,3 | 7,9 | 17,5 | 35 | 73 | 150 | 303 | 0,49 | 0,748 | |
| 606 | Tercero Arriba | 40,3 | 13,7 | 362 | 69,8 | 60,1 | 7,5 | 17,7 | 29 | 89 | 128 | 370 | 0,70 | 0,906 | |
| 607 | Río Segundo | 34,5 | 11,6 | 312 | 68,8 | 57,9 | 6,4 | 15,9 | 35 | 81 | 139 | 340 | 0,58 | 0,759 | |
| 608 | Río Segundo | 37,6 | 13,0 | 302 | 68,3 | 58,2 | 4,8 | 16,5 | 32 | 77 | 147 | 355 | 0,52 | 0,829 | |
| 609 | San Justo | 31,6 | 10,6 | 328 | 70,3 | 56,1 | 6,3 | 13,2 | 43 | 66 | 147 | 293 | 0,45 | 0,0735 | |
| 610 |
| 36,0 | 11,9 | 362 | 71,8 | 58,9 | 4,9 | 15,6 | 37 | 82 | 121 | 313 | 0,68 | 0,773 | |