


 SUBREGION V NORTH
Planting began in May, with good soil moisture levels. Planting ended on June 24; lack of sufficient moisture in the soil led to decrease the area planted.
Fertilization was not even. Some wheat fields received proper amount of fertilizers but fertilization was insufficient in other areas and some fields were not fertilized at all.
Tillering developed under moisture deficit due to lack of rains. Temperatures were low and pest infestation was not significant.
By late July and first week in August, it rained in General San Martin and Rio Segundo departments.
Rust and yellow spot appeared in some fields planted with susceptible varieties.
To the west, in Tercero Arriba department, the first two weeks in September presented good soil moisture level. Drought found the crop at tillering, booting and with flag leaf emergence.
First week in October, the crop was booting, flag leaves were emerging as well as wheat tassels.
Second week in October, soil moisture was average in the west of Tercero Arriba and Rio Segundo departments, where yields were estimated at 2,240 kg/h.
General San Martin department got good yields, with a maximum of 2,700 kg/h. Harvest ended by mid December, with an average yield a little above 2,300 kg/h.
| MAP OF THE SUBREGION |
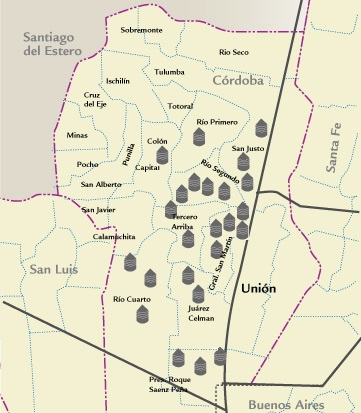
|
| |||||||||||||||||||||||||||||||||||||||||||||||||||||||||||||||||||||||
| GRADE DISTRIBUTION |
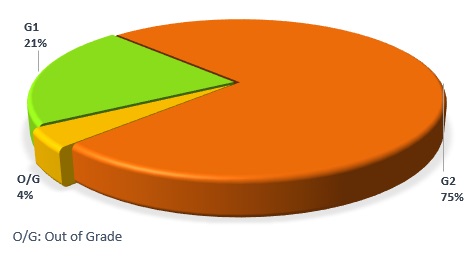
|
| FLOUR ANALYSIS | PARAMETERS | MINIMUM | MAXIMUM | AVERAGE | STANDARD DEVIATION | VARIATION COEFFICIENT | |||
| MILLING | Wet Gluten (%) | 16,4 | 27,9 | 23,2 | 3,0 | 12,74 | |||
| Dry Gluten (%) | 6,7 | 10,0 | 8,5 | 1,0 | 11,23 | ||||
| Falling Number (sec.) | 380 | 497 | 439 | 24 | 5,54 | ||||
| Flour Yield (%) | 55,0 | 67,0 | 58,7 | 2,5 | 4,31 | ||||
| Ash (dry basis) (%) | 0,548 | 0,675 | 0,614 | 0,038 | 6,21 | ||||
| FARINOGRAM | Water Absorption (14 % H°) (%) | 50,0 | 59,0 | 54,2 | 1,7 | 3,19 | |||
| Development Time(min.) | 1,2 | 24,0 | 10,4 | 6,3 | 60,25 | ||||
| Stability (min.) | 2,1 | 45,6 | 20,5 | 12,5 | 60,96 | ||||
| Degree of Softening (12 min.) | 6 | 84 | 33 | 21 | 63,03 | ||||
| ALVEOGRAM | |||||||||
| P (mm) | 66 | 118 | 81 | 11 | 13,63 | ||||
| L (mm) | 43 | 109 | 83 | 17 | 20,40 | ||||
| W Joules x 10-4 | 156 | 297 | 236 | 42 | 17,72 | ||||
| P / L | 0,65 | 2,57 | 1,05 | 0,44 | 41,61 | ||||
| These results were elaborated with 24 composite samples prepared proportionally from 146 primary samples. | |||||||||
SUBREGION DATA
In this sub region the wheat production was 1.341.850 tons., the 11,9 % of the national total. Were sampled 111.141 tons., the 8,3 % of the sub region production.
| APPENDIX OF LOCALITY COMPOSITE SAMPLES | |||||||||||||
| SAMPLE IDENTIFICATION | WHEAT ANALYSIS | ||||||||||||
| SAMPLE NUMBER | LOCALITY, DISTRICT OR DEPARTMENT | TONNAJE | GRADE | TEST WEIGT (Kg/hl) | TOTAL DAMAGED KERNELS(%) | FOREIGN MATERIAL (%) |
SHRUNKEN AND BROKEN KERNELS (%) | YELLOW BERRY KERNELS (%) |
PROTEIN
(MOISTURE 13,5 % H°) |
PROTEIN (s/S.S.S.) |
WEIGT OF 1000 KERNELS | ASH(dry basis) % | |
| 600 | Río Primero | 3300 | 1 | 79,90 | 0,37 | 0,09 | 0,32 | 13,50 | 9,5 | 11,0 | 37,86 | 1,779 | |
| 601 | Colón | 2000 | 1 | 80,80 | 0,13 | 0,18 | 0,07 | 0,40 | 10,1 | 11,7 | 41,27 | 2,077 | |
| 602 | Juárez Celman | 4000 | 1 | 79,00 | 0,56 | 0,38 | 0,81 | 4,90 | 10,0 | 11,6 | 31,06 | 1,642 | |
| 603 | Juárez Celman | 4000 | 2 | 80,35 | 0,50 | 0,35 | 0,79 | 1,60 | 11,4 | 13,2 | 33,42 | 1,739 | |
| 604 | Río Cuarto | 4000 | 2 | 79,90 | 0,72 | 0,28 | 0,59 | 0,65 | 11,0 | 12,7 | 33,23 | 1,674 | |
| 605 | Río Cuarto | 4000 | 2 | 80,15 | 0,59 | 0,26 | 0,65 | 1,00 | 11,1 | 12,8 | 33,16 | 1,710 | |
| 606 | Río Cuarto | 4000 | 1 | 80,80 | 0,73 | 0,14 | 0,34 | 2,00 | 11,7 | 13,5 | 33,12 | 1,705 | |
| 607 | Río Segundo | 4000 | 2 | 78,15 | 0,58 | 0,25 | 0,77 | 4,00 | 9,8 | 11,3 | 31,15 | 1,742 | |
| 608 | Río Segundo | 4050 | 2 | 78,60 | 0,32 | 0,37 | 0,70 | 9,20 | 9,6 | 11,1 | 30,53 | 1,885 | |
| 609 | General San Martín | 2800 | 2 | 79,45 | 0,22 | 0,12 | 0,54 | 2,50 | 10,4 | 12,0 | 32,41 | 1,711 | |
| 610 |
| 6000 | 2 | 77,45 | 1,56 | 0,19 | 0,75 | 2,30 | 9,9 | 11,4 | 32,72 | 1,837 | |
| 611 |
| 5500 | 2 | 79,00 | 0,54 | 0,23 | 0,47 | 0,90 | 10,8 | 12,5 | 34,82 | 1,811 | |
| 612 |
| 6000 | 1 | 79,00 | 0,58 | 0,18 | 0,37 | 3,90 | 11,0 | 12,7 | 34,93 | 1,756 | |
| 613 |
| 3500 | 2 | 78,80 | 0,38 | 0,22 | 0,67 | 2,40 | 10,7 | 12,4 | 32,74 | 1,777 | |
| 614 |
| 6000 | 2 | 78,60 | 0,41 | 0,35 | 0,63 | 1,80 | 10,3 | 11,9 | 30,84 | 1,805 | |
| 615 |
| 5500 | F/E | 79,70 | 0,45 | 1,60 | 0,42 | 4,20 | 10,7 | 12,4 | 33,15 | 1,801 | |
| 616 |
| 7000 | 2 | 80,60 | 0,27 | 0,23 | 0,84 | 0,40 | 11,7 | 13,5 | 30,03 | 2,031 | |
| 617 |
| 5000 | 2 | 79,90 | 0,39 | 0,34 | 0,23 | 11,80 | 9,8 | 11,3 | 35,19 | 1,690 | |
| 618 |
| 7400 | 2 | 79,45 | 0,48 | 0,18 | 0,55 | 0,70 | 11,5 | 13,3 | 33,30 | 2,282 | |
| 619 |
| 4000 | 2 | 78,80 | 0,39 | 0,14 | 0,68 | 1,00 | 11,3 | 13,1 | 31,43 | 1,876 | |
| 620 |
| 5000 | 2 | 78,80 | 0,57 | 0,14 | 0,24 | 9,50 | 10,0 | 11,6 | 34,82 | 1,690 | |
| 621 |
| 4004 | 2 | 78,35 | 0,26 | 0,18 | 0,33 | 7,10 | 9,0 | 10,4 | 34,12 | 1,736 | |
| 622 |
| 4243 | 2 | 77,90 | 0,33 | 0,18 | 0,24 | 4,40 | 8,6 | 9,9 | 35,54 | 1,466 | |
| 623 |
| 5844 | 2 | 76,80 | 0,38 | 0,37 | 0,47 | 1,80 | 10,5 | 12,1 | 30,88 | 1,890 | |
| APPENDIX OF LOCALITY COMPOSITE SAMPLES | |||||||||||||||
| SAMPLE IDENTIFICATION | FLOUR ANALYSIS | ||||||||||||||
| SAMPLE NUMBER |
LOCALITY, DISTRICT OR DEPARTMENT | WET GLUTEN(%) | DRY GLUTEN(%) | FALLING NUMBER (SEC.) | FLOUR YIELD(%) | FARINOGRAM | ALVEOGRAM | ASH(dry basis)(%) | |||||||
| % WA(14% H°) | T, D, (MIN.) | STABILITY (MIN.) | DEGREE SOFTENING (12 MIN.) | P | L | W | P/L | ||||||||
| 600 | Río Primero | 19,4 | 7,2 | 430 | 63,4 | 54,5 | 6,7 | 8,2 | 78 | 95 | 43 | 156 | 2,21 | 0,614 | |
| 601 | Colón | 21,8 | 8,0 | 497 | 56,1 | 59,0 | 8,3 | 25,3 | 15 | 118 | 46 | 212 | 2,57 | 0,656 | |
| 602 | Juárez Celman | 21,1 | 7,9 | 477 | 57,8 | 53,1 | 18,1 | 38,2 | 17 | 85 | 75 | 233 | 1,13 | 0,573 | |
| 603 | Juárez Celman | 26,7 | 9,6 | 444 | 57,8 | 54,8 | 10,1 | 23,4 | 19 | 72 | 103 | 253 | 0,70 | 0,610 | |
| 604 | Río Cuarto | 26,1 | 9,3 | 472 | 60,6 | 54,3 | 12,1 | 26,1 | 24 | 83 | 103 | 287 | 0,81 | 0,583 | |
| 605 | Río Cuarto | 26,5 | 9,6 | 479 | 61,0 | 55,7 | 9,2 | 18,1 | 34 | 82 | 99 | 277 | 0,83 | 0,548 | |
| 606 | Río Cuarto | 27,9 | 10,0 | 468 | 59,4 | 54,4 | 8,8 | 17,5 | 33 | 71 | 109 | 257 | 0,65 | 0,552 | |
| 607 | Río Segundo | 20,8 | 7,7 | 420 | 59,2 | 53,5 | 1,7 | 4,5 | 55 | 70 | 88 | 198 | 0,80 | 0,573 | |
| 608 | Río Segundo | 20,8 | 7,6 | 452 | 58,2 | 53,1 | 1,7 | 2,5 | 56 | 71 | 89 | 206 | 0,80 | 0,595 | |
| 609 | General San Martín | 22,3 | 8,3 | 450 | 56,8 | 54,1 | 24,0 | 45,6 | 15 | 105 | 62 | 264 | 1,69 | 0,613 | |
| 610 | General San Martín | 22,8 | 8,3 | 410 | 57,7 | 54,4 | 1,8 | 3,0 | 50 | 68 | 98 | 211 | 0,69 | 0,671 | |
| 611 | General San Martín | 24,8 | 9,1 | 452 | 67,0 | 53,3 | 11,0 | 21,4 | 29 | 71 | 78 | 195 | 0,91 | 0,675 | |
| 612 | General San Martín | 23,6 | 8,7 | 433 | 59,3 | 54,3 | 19,1 | 31,3 | 17 | 92 | 88 | 291 | 1,05 | 0,573 | |
| 613 | General San Martín | 23,4 | 8,5 | 411 | 57,7 | 54,4 | 17,9 | 29,1 | 22 | 82 | 104 | 297 | 0,79 | 0,592 | |
| 614 | Río Segundo | 23,3 | 8,5 | 446 | 56,4 | 53,6 | 15,4 | 30,8 | 13 | 83 | 78 | 237 | 1,06 | 0,619 | |
| 615 | Pte. Roque Sáenz Peña | 25,4 | 9,3 | 412 | 56,6 | 57,4 | 1,8 | 4,5 | 42 | 90 | 76 | 249 | 1,18 | 0,632 | |
| 616 | Río Segundo | 26,5 | 9,6 | 455 | 55,0 | 55,7 | 11,6 | 26,3 | 19 | 82 | 100 | 285 | 0,82 | 0,675 | |
| 617 | Pte. Roque Sáenz Peña | 23,0 | 8,3 | 412 | 58,3 | 55,0 | 1,9 | 2,6 | 67 | 77 | 74 | 198 | 1,04 | 0,571 | |
| 618 | Tercero Arriba | 25,8 | 9,4 | 442 | 58,6 | 55,9 | 10,5 | 19,1 | 27 | 87 | 88 | 275 | 0,99 | 0,645 | |
| 619 | Tercero Arriba | 25,1 | 9,2 | 454 | 56,7 | 54,9 | 14,8 | 26,2 | 17 | 88 | 88 | 296 | 1,00 | 0,618 | |
| 620 | Pte. Roque Sáenz Peña | 22,4 | 8,2 | 433 | 58,6 | 54,4 | 1,2 | 2,1 | 84 | 66 | 94 | 210 | 10,70 | 0,585 | |
| 621 | San Justo | 18,1 | 6,7 | 419 | 59,0 | 51,4 | 14,1 | 30,0 | 18 | 84 | 67 | 202 | 1,25 | 0,615 | |
| 622 | San Justo | 16,4 | 6,7 | 380 | 57,6 | 51,8 | 17,5 | 42,4 | 6 | 99 | 43 | 175 | 2,30 | 0,606 | |
| 623 | San Justo | 18,1 | 6,8 | 435 | 59,5 | 50,0 | 14,6 | 27,5 | 24 | 67 | 71 | 174 | 0,94 | 0,645 | |