


 SUBREGION II SOUTH
 Water excess prevented wheat planting in some fields.
Accumulated rains were above historical levels but not as high as record rains in 2014. In the fall, water accumulation within the soil profile before planting was excellent.
Planting was completed in June and July. Short and mainly long cycle wheat was planted. Planting completion was delayed in some areas because soil moisture was not adequate to foster seedling.
Phosphate fertilizers were applied at planting. Nitrogen fertilization was used before planting or at planting/tillering. In June and August, ambient temperatures were above historical averages, which led to rapid seedling and good crop growth; no cold temperatures could damage the developing wheat.
Tillering was under heavy rains in most of the region: most N was washed away and little remained for the crop.
At booting and flowering, temperatures were below average, and plant tassels came out 7 to 10 days later than usual. Flowering was under no rain conditions, but grain filling (Oct 20 to November 20) was under moderate rain and low temperatures.
Attacks of Puccinia triticina caused wheat leaf rust and Puccinia graminis caused stem rust, mostly on susceptible germplasm varieties. These attacks were severe, especially during grain filling. Bad pest management practices due to lack of knowledge led to significant losses in some fields. There were not any significant Fusarium graminearum attacks.
Harvest was completed under excellent weather conditions, no rains. It started by December 5 and ended on the 15th.
Yields were uneven due to infestations in susceptible cultivars, excess rains and nutrients washing at grain filling. Average yields in the north of the region ranged from 3,200 to -3,800 kg/ha; to the south, yields ranged from 3,500 to -4,500 kg/ha.
Grain commercial quality ranged from average to poor. The crop presented low protein content and low test weight. Some fields yielded grain of unacceptable quality or grain that suffered strong discounts.
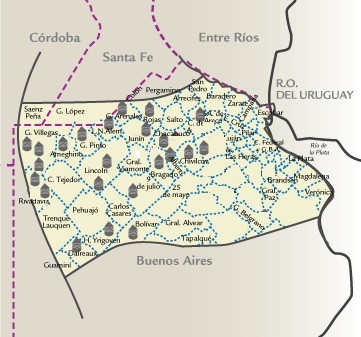
| MAP OF THE SUBREGION |
|
| |||||||||||||||||||||||||||||||||||||||||||||||||||||||||||||||||||||||
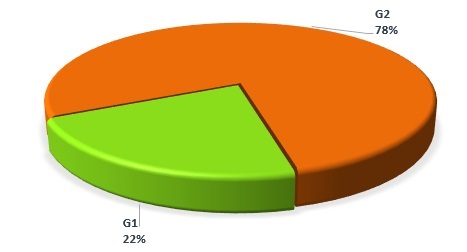
| GRADE DISTRIBUTION |
|
| FLOUR ANALYSIS | PARAMETERS | MINIMUM | MAXIMUM | AVERAGE | STANDARD DEVIATION | VARIATION COEFFICIENT | |||
| MILLING | Wet Gluten (%) | 16,7 | 24,9 | 21,3 | 1,8 | 8,36 | |||
| Dry Gluten (%) | 6,2 | 9,2 | 7,9 | 0,7 | 8,40 | ||||
| Falling Number (sec.) | 346 | 559 | 417 | 47 | 11,35 | ||||
| Flour Yield (%) | 63,0 | 63,0 | 63,0 | 0,0 | 0,00 | ||||
| Ash (dry basis) (%) | 0,509 | 0,646 | 0,557 | 0,032 | 5,78 | ||||
| FARINOGRAM | Water Absorption (14 % H°) (%) | 50,8 | 56,3 | 53,9 | 1,4 | 2,62 | |||
| Development Time(min.) | 2,8 | 20,0 | 12,4 | 7,6 | 61,28 | ||||
| Stability (min.) | 5,5 | 59,2 | 34,0 | 16,3 | 47,95 | ||||
| Degree of Softening (12 min.) | 0 | 53 | 19 | 16 | 85,95 | ||||
| ALVEOGRAM | |||||||||
| P (mm) | 63 | 120 | 97 | 15 | 15,05 | ||||
| L (mm) | 33 | 75 | 52 | 13 | 25,68 | ||||
| W Joules x 10-4 | 138 | 266 | 205 | 37 | 18,06 | ||||
| P / L | 0,84 | 3,64 | 2,03 | 0,71 | 34,99 | ||||
| These results were elaborated with 23 composite samples prepared proportionally from 300 primary samples (farmer deliveries). | |||||||||
SUBREGION DATA
| APPENDIX OF LOCALITY COMPOSITE SAMPLES | |||||||||||||
| SAMPLE IDENTIFICATION | WHEAT ANALYSIS | ||||||||||||
| SAMPLE NUMBER | LOCALITY, DISTRICT OR DEPARTMENT | TONNAJE | GRADE | TEST WEIGT (Kg/hl) | TOTAL DAMAGED KERNELS(%) | FOREIGN MATERIAL (%) |
SHRUNKEN AND BROKEN KERNELS (%) | YELLOW BERRY KERNELS (%) |
PROTEIN
(MOISTURE 13,5 % H°) |
PROTEIN (s/S.S.S.) |
WEIGT OF 1000 KERNELS | ASH(dry basis) % | |
| 200 | General Arenales | 4000 | 1 | 81,70 | 0,24 | 0,18 | 0,24 | 4,42 | 11,0 | 12,7 | 35,8 | 1,786 | |
| 201 | Rojas | 4000 | 1 | 79,45 | 0,08 | 0,16 | 0,20 | 2,06 | 9,4 | 10,9 | 32,4 | 1,787 | |
| 202 | Junín | 2000 | 2 | 81,7 | 0,20 | 0,34 | 0,32 | 3,46 | 10,1 | 11,7 | 34,0 | 1,864 | |
| 203 | Chacabuco | 4000 | 2 | 81,05 | 0,23 | 0,70 | 0,18 | 4,30 | 10,5 | 12,1 | 36,1 | 1,764 | |
| 204 | San Andrés de Giles | 2000 | 2 | 79,25 | 0,28 | 0,36 | 0,62 | 4,82 | 9,3 | 10,8 | 29,5 | 1,712 | |
| 205 | Bragado | 4000 | 2 | 79,9 | 0,07 | 0,42 | 0,20 | 3,92 | 9,7 | 11,2 | 32,51 | 1,595 | |
| 206 | Alberti | 4000 | 2 | 81,95 | 0,30 | 0,52 | 0,12 | 4,30 | 9,9 | 11,4 | 36,18 | 1,712 | |
| 207 | 9 de Julio | 4000 | 2 | 78,6 | 0,64 | 0,16 | 0,38 | 0,5 | 9,2 | 10,6 | 33,39 | 1,539 | |
| 208 | Chivilcoy | 4000 | 2 | 77,45 | 0,29 | 0,42 | 0,54 | 4,28 | 10,1 | 11,7 | 33,01 | 1,812 | |
| 209 | Suipacha | 1000 | 2 | 77,25 | 0,16 | 0,40 | 0,52 | 4,9 | 8,5 | 9,8 | 28,54 | 1,700 | |
| 210 |
| 4000 | 1 | 80,35 | 0,42 | 0,1 | 0,28 | 2,92 | 9,6 | 11,1 | 35,8 | 1,667 | |
| 211 |
| 4000 | 2 | 82,4 | 0,18 | 0,42 | 0,48 | 1,38 | 10,5 | 12,1 | 37,06 | 1,606 | |
| 212 |
| 2000 | 2 | 76,8 | 0,12 | 0,32 | 0,38 | 0,92 | 9,7 | 11,2 | 32,54 | 1,593 | |
| 213 |
| 4000 | 1 | 80,35 | 0,26 | 0,18 | 0,44 | 3,00 | 9,8 | 11,3 | 33,04 | 1,808 | |
| 214 |
| 4000 | 2 | 79,45 | 0,52 | 0,18 | 0,56 | 5,2 | 10,2 | 11,8 | 33,87 | 1,700 | |
| 215 |
| 4000 | 2 | 79,70 | 0,28 | 0,12 | 0,56 | 3,74 | 10,0 | 11,6 | 33,06 | 1,710 | |
| 216 |
| 4000 | 2 | 78,35 | 0,22 | 0,34 | 0,38 | 0,94 | 10,4 | 12,0 | 32,19 | 1,674 | |
| 217 |
| 2000 | 2 | 76,35 | 0,20 | 0,50 | 0,34 | 2,04 | 9,3 | 10,8 | 31,39 | 1,697 | |
| 218 |
| 4000 | 2 | 77,25 | 0,28 | 0,36 | 0,10 | 2,88 | 10,2 | 11,8 | 32,63 | 1,691 | |
| 219 |
| 4000 | 2 | 79,45 | 0,10 | 0,32 | 0,30 | 0,86 | 9,5 | 11,0 | 33,74 | 1,563 | |
| 220 |
| 2000 | 2 | 79,25 | 0,10 | 0,50 | 0,20 | 0,00 | 10,5 | 12,1 | 34,27 | 1,685 | |
| 221 |
| 4000 | 2 | 78,15 | 0,29 | 0,06 | 0,12 | 1,12 | 10,0 | 11,6 | 33,23 | 1,602 | |
| 222 |
| 4000 | 1 | 80,6 | 0,32 | 0,10 | 0,24 | 6,34 | 9,6 | 11,1 | 34,21 | 1,638 | |
| APPENDIX OF LOCALITY COMPOSITE SAMPLES | |||||||||||||||
| SAMPLE IDENTIFICATION | FLOUR ANALYSIS | ||||||||||||||
| SAMPLE NUMBER |
LOCALITY, DISTRICT OR DEPARTMENT | WET GLUTEN(%) | DRY GLUTEN(%) | FALLING NUMBER (SEC.) | FLOUR YIELD(%) | FARINOGRAM | ALVEOGRAM | ASH(dry basis)(%) | |||||||
| % WA(14% H°) | T, D, (MIN.) | STABILITY (MIN.) | DEGREE SOFTENING (12 MIN.) | P | L | W | P/L | ||||||||
| 200 | General Arenales | 24,9 | 9,2 | 382 | 63 | 56,1 | 11,7 | 35,4 | 20 | 97 | 71 | 266 | 1,37 | 0,590 | |
| 201 | Rojas | 18,6 | 6,9 | 370 | 63 | 52,4 | 3,9 | 10,8 | 43 | 88 | 48 | 178 | 1,83 | 0,570 | |
| 202 | Junín | 22,2 | 8,2 | 378 | 63 | 54,2 | 6,3 | 23,1 | 13 | 83 | 72 | 233 | 1,15 | 0,584 | |
| 203 | Chacabuco | 23,2 | 8,6 | 397 | 63 | 56,1 | 20,0 | 46,3 | 17 | 120 | 49 | 254 | 2,45 | 0,606 | |
| 204 | San Andrés de Giles | 19,6 | 7,3 | 382 | 63 | 51,0 | 6,1 | 33,5 | 27 | 86 | 53 | 190 | 1,62 | 0,531 | |
| 205 | Bragado | 20,8 | 7,7 | 393 | 63 | 54,5 | 3,5 | 23,1 | 32 | 93 | 61 | 222 | 1,52 | 0,549 | |
| 206 | Alberti | 21,2 | 7,9 | 407 | 63 | 54,2 | 4,0 | 22,1 | 22 | 84 | 71 | 230 | 1,18 | 0,550 | |
| 207 | 9 de Julio | 18,9 | 7,0 | 378 | 63 | 54,4 | 2,8 | 5,5 | 53 | 98 | 38 | 164 | 2,58 | 0,525 | |
| 208 | Chivilcoy | 22,1 | 8,2 | 405 | 63 | 53,6 | 4,5 | 20,3 | 25 | 78 | 56 | 176 | 1,39 | 0,586 | |
| 209 | Suipacha | 16,7 | 6,2 | 318 | 63 | 50,8 | 3,8 | 8,8 | 45 | 98 | 35 | 153 | 2,8 | 0,538 | |
| 210 | Bolívar | 22,0 | 8,2 | 402 | 63 | 54,4 | 6,8 | 11,9 | 52 | 63 | 75 | 164 | 0,84 | 0,646 | |
| 211 | Daireaux | 24,1 | 8,9 | 471 | 63 | 56,3 | 3,8 | 17,2 | 15 | 95 | 68 | 247 | 1,4 | 0,581 | |
| 212 | Hipólito Yrigoyen | 19,5 | 7,2 | 409 | 63 | 51,4 | 20 | 59 | 0 | 100 | 44 | 195 | 2,27 | 0,545 | |
| 213 | General Villegas | 21,4 | 7,9 | 426 | 63 | 54,2 | 20 | 54 | 2 | 113 | 41 | 202 | 2,76 | 0,547 | |
| 214 | General Villegas | 22,1 | 8,2 | 454 | 63 | 54,3 | 20 | 46,5 | 3 | 116 | 42 | 216 | 2,76 | 0,556 | |
| 215 | General Villegas | 21,4 | 7,9 | 390 | 63 | 53,3 | 20 | 59,2 | 4 | 112 | 45 | 219 | 2,49 | 0,549 | |
| 216 | Lincoln | 22,8 | 8,5 | 436 | 63 | 53,6 | 5,8 | 32,9 | 14 | 105 | 37 | 175 | 2,84 | 0,547 | |
| 217 | Lincoln | 18,4 | 6,8 | 346 | 63 | 50,9 | 20 | 48,2 | 1 | 81 | 38 | 138 | 2,13 | 0,509 | |
| 218 | Leandro N. Alem | 21,3 | 7,9 | 402 | 63 | 53,5 | 20 | 50,1 | 9 | 120 | 33 | 182 | 3,64 | 0,534 | |
| 219 | General Pinto | 19,6 | 7,2 | 424 | 63 | 51,9 | 20 | 50,8 | 8 | 92 | 61 | 233 | 1,51 | 0,521 | |
| 220 | Florentino Ameghino | 22,8 | 8,5 | 380 | 63 | 55,2 | 20 | 49,2 | 6 | 104 | 65 | 266 | 1,60 | 0,567 | |
| 221 | Rivadavia | 20,7 | 7,7 | 559 | 63 | 53,1 | 20 | 36,8 | 5 | 103 | 55 | 237 | 1,87 | 0,524 | |
| 222 | Rivadavia | 19,5 | 7,2 | 501 | 63 | 53,7 | 20 | 39,4 | 8 | 88 | 35 | 138 | 2,51 | 0,524 | |