


 SUBREGION II SOUTH
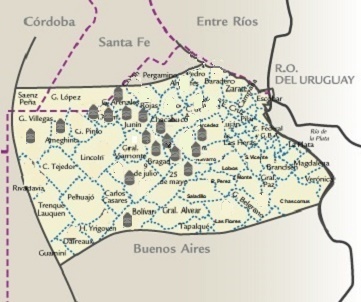
| | MAP OF THE SUBREGION |
 |
| |||||||||||||||||||||||||||||||||||||||||||||||||||||||||||||||||||||||
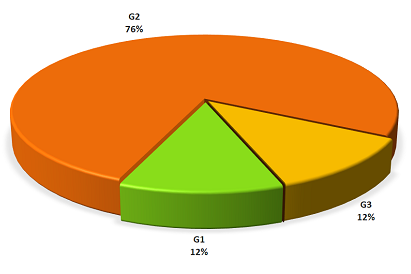
| | GRADE DISTRIBUTION |
|
| | ANALISIS DE LA HARINA | ENSAYOS | MÍNIMO | MÁXIMO | PROMEDIO | DESVÍO ESTÁNDAR | COEFICIENTE VARIACIÓN | ||
| MILLING | Wet Gluten (%) | 20,9 | 29,6 | 26,4 | 2,1 | 8,03 | |||
| Dry Gluten (%) | 7,8 | 11,0 | 9,8 | 0,8 | 8,05 | ||||
| Falling Number (seg.) | 349 | 418 | 380 | 21 | 5,41 | ||||
| Flour Yield (%) | 68,9 | 73,6 | 70,9 | 1,2 | 1,63 | ||||
| Ash (dry basis) (%) | 0,529 | 0,785 | 0,646 | 0,071 | 11,01 | ||||
| FARINOGRAM | WaterAbsorption(14H°)(%) | 50,0 | 61,0 | 56,8 | 2,4 | 4,19 | |||
| Development Time (min.) | 3,1 | 10,7 | 6,5 | 2,3 | 35,88 | ||||
| Stability (min.) | 6,3 | 18,2 | 13,3 | 3,1 | 23,30 | ||||
| Degree of Softening (12min.) | 28 | 69 | 48 | 11 | 21,73 | ||||
| ALVEOGRAM | |||||||||
| P (mm) | 55 | 129 | 89 | 18 | 20,08 | ||||
| L (mm) | 51 | 122 | 75 | 18 | 24,77 | ||||
| W Joules x 10-4 | 199 | 287 | 235 | 25 | 10,71 | ||||
| P / L | 0,45 | 2,53 | 1,20 | 0,55 | 46,02 | ||||
| These results were elaborated with 17 composite samples prepared proportionally from 268 primary samples (farmer deliveries) | |||||||||
SUBREGION DATA
In this sub region the wheat production was 4.233.057 tons., the 21,8% of the national total. Were sampled 63.000 tons., the 1,5% of the sub region production.| APPENDIX OF LOCALITY COMPOSITE SAMPLES | |||||||||||||
| SAMPLE IDENTIFICATION | WHEAT ANALYSIS | ||||||||||||
| SAMPLE NUMBER | LOCALITY, DISTRICT OR DEPARTMENT | TONNAJE | GRADE | TEST WEIGT (Kg/hl) |
TOTAL DAMAGED KERNELS (%) | FOREIGN MATERIAL (%) |
SHRUNKEN AND BROKEN KERNELS (%) | YELLOW BERRY KERNELS (%) |
PROTEIN (MOISTURE 13,5 % H°) (%) |
PROTEIN (dry basis) (%) |
WEIGT OF 1000 KERNELS (g) |
ASH (dry basis) (%) | |
| 200 |
| 4000 | 2 | 78,90 | 0,52 | 0,40 | 0,52 | 0,40 | 11,6 | 13,4 | 35,52 | 2,164 | |
| 201 |
| 4000 | 2 | 78,30 | 0,47 | 0,26 | 0,19 | 0,49 | 11,5 | 13,3 | 36,77 | 1,835 | |
| 202 |
| 4000 | 2 | 77,40 | 0,57 | 0,43 | 0,30 | 2,59 | 10,7 | 12,4 | 35,19 | 1,8180 | |
| 203 |
| 2000 | 2 | 77,80 | 0,40 | 0,19 | 0,16 | 1,67 | 11,7 | 13,5 | 33,5 | 1,854 | |
| 204 |
| 4000 | 2 | 77,00 | 0,53 | 0,94 | 0,26 | 3,74 | 11,1 | 12,8 | 34,03 | 1,887 | |
| 205 |
| 4000 | 2 | 77,50 | 0,67 | 0,15 | 0,31 | 0,39 | 10,9 | 12,6 | 36,07 | 1,826 | |
| 206 |
| 4000 | 2 | 76,20 | 0,53 | 0,22 | 0,39 | 2,09 | 10,8 | 12,5 | 34,84 | 1,774 | |
| 207 |
| 4000 | 1 | 79,40 | 0,54 | 0,19 | 0,17 | 1,50 | 11,4 | 13,2 | 35,22 | 1,901 | |
| 208 | Rojas | 4000 | 2 | 82,10 | 0,46 | 0,27 | 0,30 | 0,16 | 11,8 | 13,6 | 35,71 | 1,919 | |
| 209 |
| 4000 | 1 | 79,20 | 0,32 | 0,18 | 0,36 | 2,92 | 10,4 | 12,0 | 36,55 | 1,72 | |
| 210 |
| 4000 | 2 | 77,30 | 0,39 | 0,56 | 0,28 | 1,12 | 10,3 | 11,9 | 35,34 | 1,802 | |
| 211 |
| 4000 | 2 | 76,80 | 0,52 | 0,40 | 0,22 | 0,64 | 11,0 | 12,7 | 35,09 | 1,936 | |
| 212 |
| 3000 | 3 | 76,30 | 0,49 | 0,36 | 1,42 | 0,00 | 11,0 | 12,7 | 33,53 | 1,927 | |
| 213 |
| 2000 | 2 | 81,50 | 0,27 | 0,24 | 0,26 | 3,60 | 11,9 | 13,8 | 37,47 | 1,887 | |
| 214 |
| 4000 | 2 | 79,20 | 0,46 | 0,26 | 0,36 | 0,92 | 11,3 | 13,1 | 36,27 | 1,872 | |
| 215 |
| 4000 | 2 | 77,80 | 0,27 | 0,24 | 0,27 | 5,29 | 10,5 | 12,1 | 35,35 | 1,750 | |
| 216 |
| 4000 | 2 | 78,60 | 1,17 | 0,16 | 0,38 | 0,69 | 11,8 | 13,6 | 35,07 | 1,759 | |
| 217 |
| 4000 | 3 | 74,50 | 0,36 | 1,12 | 0,32 | 5,52 | 10,0 | 11,6 | 34,74 | 1,708 | |
| APPENDIX OF LOCALITY COMPOSITE SAMPLES | |||||||||||||||
| SAMPLE IDENTIFICATION | FLOUR ANALYSIS | ||||||||||||||
| SAMPLE NUMBER | LOCALITY, DISTRICT OR DEPARTMENT | WET GLUTEN(%) | DRY GLUTEN(%) | FALLING NUMBER (sec.) | FLOUR YIELD(%) | FARINOGRAM | ALVEOGRAM | ASH(dry basis)(%) | |||||||
| % WA (14 % H°) | D. T. (min.) | STABILITY (min.) | DEGREE SOFTENING(12 min.) | P | L | W | P/L | ||||||||
| 200 | Chivilcoy | 27,4 | 10,2 | 378 | 70,00 | 56,4 | 10,7 | 15,7 | 59 | 84 | 79 | 250 | 1,06 | 0,560 | |
| 201 | Chivilcoy | 26,3 | 9,7 | 371 | 69,80 | 56,0 | 9,0 | 14,5 | 53 | 80 | 81 | 230 | 0,99 | 0,550 | |
| 202 | Chivilcoy | 24,9 | 9,2 | 360 | 70,00 | 55,2 | 7,2 | 13,9 | 50 | 75 | 84 | 231 | 0,89 | 0,538 | |
| 203 | Bragado | 24,8 | 9,1 | 360 | 71,00 | 56,5 | 4,0 | 14,5 | 30 | 116 | 57 | 249 | 2,04 | 0,771 | |
| 204 | Bragado | 24,8 | 9,2 | 355 | 70,90 | 61,0 | 4,5 | 12,0 | 50 | 129 | 51 | 264 | 2,53 | 0,681 | |
| 205 | Bragado | 26,2 | 9,7 | 374 | 71,30 | 55,2 | 8,6 | 18,2 | 35 | 71 | 104 | 252 | 0,68 | 0,613 | |
| 206 | 9 de Julio | 24,0 | 8,9 | 390 | 71,00 | 56,3 | 3,1 | 6,3 | 55 | 98 | 57 | 215 | 1,72 | 0,651 | |
| 207 | Alberti | 27,8 | 10,3 | 418 | 70,90 | 57,4 | 9,2 | 15,8 | 51 | 88 | 86 | 280 | 1,02 | 0,672 | |
| 208 | Rojas | 28,5 | 10,6 | 410 | 71,80 | 57,5 | 9,0 | 14,1 | 45 | 91 | 64 | 223 | 1,42 | 0,665 | |
| 209 | General Pinto | 29,5 | 10,9 | 415 | 71,60 | 59,5 | 8,4 | 14,2 | 55 | 88 | 91 | 287 | 0,97 | 0,657 | |
| 210 | General Pinto | 26,9 | 9,9 | 367 | 70,10 | 59,3 | 4,0 | 11,8 | 49 | 115 | 51 | 239 | 2,25 | 0,785 | |
| 211 | Florentino Ameghino | 28,9 | 10,7 | 403 | 70,90 | 55,1 | 7,0 | 11,2 | 61 | 55 | 122 | 202 | 0,45 | 0,667 | |
| 212 | General Villegas | 25,6 | 9,4 | 381 | 70,20 | 57,6 | 4,8 | 10,7 | 50 | 85 | 64 | 200 | 1,33 | 0,621 | |
| 213 | Leandro N. Alem | 29,6 | 11,0 | 384 | 73,60 | 60,1 | 8,0 | 10,7 | 69 | 86 | 68 | 199 | 1,26 | 0,650 | |
| 214 | Leandro N. Alem | 27,0 | 10,0 | 349 | 69,40 | 56,3 | 3,5 | 8,7 | 52 | 81 | 72 | 210 | 1,130 | 0,630 | |
| 215 | Lincoln | 24,8 | 9,2 | 377 | 73,10 | 55,3 | 4,7 | 16,9 | 28 | 89 | 72 | 242 | 1,24 | 0,646 | |
| 216 | 25 de Mayo | 26,4 | 9,7 | 354 | 68,90 | 57,6 | 4,1 | 11,5 | 43 | 107 | 55 | 229 | 1,95 | 0,743 | |
| 217 | Bolívar | 20,9 | 7,8 | 385 | 71,40 | 50 | 7,5 | 18,1 | 35 | 67 | 83 | 222 | 0,81 | 0,529 | |