


 SUBREGION III
The 2012 wheat campaign initiated with scarce humidity in autumn, particularly in the months of March and April, with a deficit for the historical average of over 100 mm. Later, eventual rains in May improved the refill of the soil profile and, although June and July were dryer than expected, abundant rains in August refilled the profile, therefore, it was believed that this would be a good campaign. However, these rains continued in September and particularly in October casing a lower radiation and thus a decrease in the expected yield, and mainly, a strong incidence of Ear Fusarium (Fusarium spp), which brought about not only a decrease in the yield but also a bad industrial and commercial quality.
As regards the temperatures during the crop cycle, except for July that was colder than the historical average, the other months when the crop develops and grows were milder than the expected average, which also influenced in the potential yield.
As regards the leaf diseases, there were significant levels of Yellow Spot (Dreschslera tritici repentis), and some cases in highly susceptible crops, Leaf Rust (Puccinia triticina Erikss).
Therefore, obtained yields were low and harvested grains presented some quality problems.
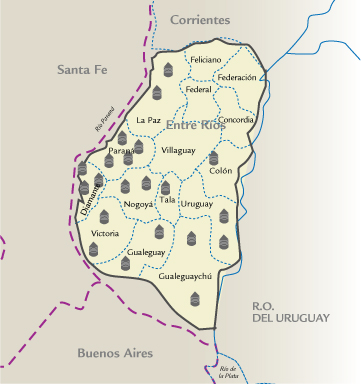
| MAP OF THE SUBREGION |
|
| |||||||||||||||||||||||||||||||||||||||||||||||||||||||||||||||||||||
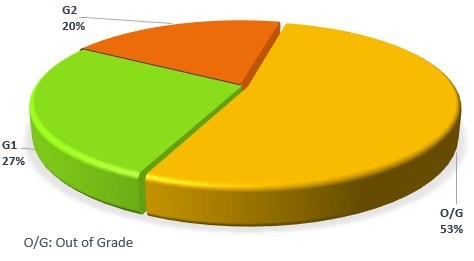
| GRADE DISTRIBUTION |
|
| FLOUR ANALYSIS | PARAMETERS | MINIMUM | MAXIMUM | AVERAGE | STANDARD DEVIATION | VARIATION COEFFICIENT | |||
| MILLING | Wet Gluten (%) | 23,4 | 30,7 | 27,0 | 1,9 | 7,01 | |||
| Dry Gluten (%) | 7,8 | 10,1 | 9,0 | 0,6 | 6,89 | ||||
| Falling Number (seg.) | 358 | 448 | 411 | 24 | 5,77 | ||||
| Flour Yield (%) | 69,1 | 74,8 | 71,8 | 1,6 | 2,26 | ||||
| Ash (dry basis) (%) | 0,565 | 0,835 | 0,704 | 0,066 | 9,42 | ||||
| FARINOGRAM | Water Absorption (14% H°) (%) | 55,3 | 59,7 | 57,3 | 0,9 | 1,49 | |||
| Development Time (min.) | 3,8 | 6,2 | 5,2 | 0,5 | 10,18 | ||||
| Stability (min.) | 3,7 | 9,1 | 6,8 | 1,4 | 20,32 | ||||
| Degree of Softening (12 min.) | 74 | 106 | 88 | 10 | 10,90 | ||||
| P (mm) | 57 | 72 | 62 | 4 | 6,55 | ||||
| ALVEOGRAM | |||||||||
| L (mm) | 84 | 125 | 109 | 11 | 10,16 | ||||
| W Joules x 10-4 | 151 | 230 | 191 | 22 | 11,47 | ||||
| P / L | 0,46 | 0,86 | 0,57 | 0,09 | 15,66 | ||||
| These results were elaborated with 21 composite samples prepared proportionally from 540 primary samples (farmer deliveries) | |||||||||
SUBREGION DATA
| APPENDIX OF LOCALITY COMPOSITE SAMPLES | |||||||||||||
| SAMPLE IDENTIFICATION | WHEAT ANALYSIS | ||||||||||||
| SAMPLE NUMBER | LOCALITY, DISTRICT OR DEPARTMENT | TONNAJE | GRADE | TEST WEIGT (Kg/hl) | TOTAL DAMAGED KERNELS(%) | FOREIGN MATERIAL (%) |
SHRUNKEN AND BROKEN KERNELS (%) | YELLOW BERRY KERNELS (%) |
PROTEIN (MOISTURE 13,5 % H°) |
PROTEIN (s/S.S.S.) | WEIGT OF 1000 KERNELS | ASH(dry basis) % | |
| 300 | Paraná | 4037 | 3 | 78,6 | 2,79 | 0,16 | 0,74 | 0,62 | 11,0 | 12,7 | 34.16 | 1,930 | |
| 301 | Paraná | 4055 | F/E | 76,4 | 3,92 | 0,30 | 0,93 | 0,56 | 11,6 | 13,4 | 33,68 | 1,960 | |
| 302 | Paraná | 4035 | F/E | 77,6 | 3,40 | 0,54 | 0,94 | 12,97 | 12,1 | 14,0 | 32,76 | 1,890 | |
| 303 | Paraná | 4065 | 3 | 75,8 | 2,03 | 0,55 | 0,94 | 3,92 | 11,9 | 13,8 | 30,18 | 1,950 | |
| 304 | Villaguay | 2036 | 3 | 76,1 | 2,97 | 0,61 | 1,31 | 6,12 | 12,3 | 14,2 | 31,58 | 1,970 | |
| 305 | Diamante | 3987 | F/E | 77,4 | 3,34 | 1,44 | 0,78 | 16,30 | 11,6 | 13,4 | 34,70 | 1,950 | |
| 306 | Diamante | 3838 | F/E | 77,3 | 3,10 | 0,23 | 0,77 | 9,00 | 11,5 | 13,3 | 33,56 | 1,960 | |
| 307 | Diamante | 3879 | F/E | 76,4 | 4,44 | 0,42 | 0,92 | 4,20 | 11,8 | 13,6 | 32,30 | 2,050 | |
| 308 | La Paz | 3985 | 2 | 78,8 | 1,26 | 0,42 | 0,71 | 2,52 | 12,0 | 13,9 | 34,90 | 1,880 | |
| 309 | La Paz | 3960 | 3 | 74,7 | 1,35 | 0,95 | 0,73 | 0,86 | 12,1 | 14,0 | 33,84 | 1,880 | |
| 310 |
| 3805 | F/E | 75,3 | 3,66 | 0,52 | 0,87 | 5,59 | 12,7 | 14,7 | 33,42 | 1,920 | |
| 311 |
| 3916 | F/E | 74,8 | 4,00 | 0,33 | 0,77 | 0,67 | 11,9 | 13,8 | 30,76 | 2,070 | |
| 312 |
| 3903 | F/E | 74,5 | 5,43 | 0,39 | 0,85 | 1,94 | 12,3 | 14,2 | 29,84 | 2,070 | |
| 313 |
| 3879 | F/E | 72,4 | 3,28 | 1,43 | 1,48 | 0,00 | 12,8 | 14,8 | 32,32 | 2,040 | |
| 314 |
| 3674 | F/E | 77 | 3,91 | 0,31 | 0,86 | 13,79 | 12,0 | 13,9 | 33,26 | 1,880 | |
| 315 |
| 1898 | 3 | 73,4 | 2,88 | 2,09 | 0,54 | 0,84 | 12,3 | 14,2 | 31,94 | 2,020 | |
| 316 |
| 3979 | 3 | 77,4 | 2,76 | 0,44 | 1,02 | 6,12 | 12,7 | 14,7 | 31,54 | 1,900 | |
| 317 |
| 1983 | 3 | 74,9 | 2,59 | 0,31 | 1,03 | 4,49 | 12,5 | 14,5 | 29,36 | 1,870 | |
| 318 |
| 3917 | F/E | 74,7 | 3,28 | 0,43 | 1,01 | 8,27 | 12,3 | 14,2 | 33,62 | 1,900 | |
| 319 |
| 3984 | 3 | 74 | 2,99 | 0,20 | 0,41 | 12,24 | 12,0 | 13,9 | 31,70 | 1,860 | |
| 320 |
| 2074 | F/E | 75,6 | 4,08 | 0,18 | 1,24 | 7,66 | 12,1 | 14,0 | 32,38 | 1,980 | |
| APPENDIX OF LOCALITY COMPOSITE SAMPLES | |||||||||||||||
| SAMPLE IDENTIFICATION | WHEAT ANALYSIS | ||||||||||||||
| SAMPLE NUMBER | LOCALITY, DISTRICT OR DEPARTMENT | WET GLUTEN(%) | DRY GLUTEN(%) | FALLING NUMBER (SEG.) | FLOUR YIELD(%) | FARINOGRAM | ALVEOGRAM | ASH(dry basis)(%) | |||||||
| % AA (14 % H°) | T, D, (MIN.) | STABILITY (MIN.) | DEGREE SOFTENING(12 MIN.) | P | L | W | P//L | ||||||||
| 300 | Paraná | 23,4 | 7,8 | 429 | 71,1 | 57,0 | 5,8 | 9,1 | 76 | 72 | 84 | 201 | 0,86 | 0,645 | |
| 301 | Paraná | 25,8 | 8,8 | 380 | 71 | 58,0 | 4,9 | 6,8 | 85 | 68 | 94 | 194 | 0,72 | 0,745 | |
| 302 | Paraná | 25,3 | 8,6 | 435 | 71,7 | 57,3 | 5,0 | 8,4 | 74 | 65 | 116 | 223 | 0,56 | 0,655 | |
| 303 | Paraná | 27,6 | 9,5 | 358 | 72,7 | 55,3 | 5,8 | 9,0 | 75 | 58 | 125 | 214 | 0,46 | 0,745 | |
| 304 | Villaguay | 29,2 | 10,0 | 431 | 74,2 | 57,4 | 4,7 | 6,4 | 86 | 64 | 109 | 201 | 0,59 | 0,765 | |
| 305 | Diamante | 25,8 | 8,3 | 397 | 71,1 | 56,5 | 5,1 | 7,4 | 86 | 61 | 102 | 180 | 0,60 | 0,765 | |
| 306 | Diamante | 28,6 | 9,9 | 434 | 72,9 | 56,7 | 5,1 | 6,5 | 88 | 62 | 111 | 202 | 0,56 | 0,655 | |
| 307 | Diamante | 30,7 | 9,5 | 430 | 74,8 | 57,4 | 5,5 | 7,2 | 93 | 59 | 93 | 261 | 0,63 | 0,765 | |
| 308 | La Paz | 26,7 | 9,0 | 370 | 71,3 | 57,9 | 5,8 | 7,3 | 85 | 66 | 125 | 230 | 0,53 | 0,565 | |
| 309 | La Paz | 28,0 | 9,3 | 415 | 72,0 | 56,8 | 5,0 | 6,4 | 106 | 57 | 122 | 203 | 0,47 | 0,635 | |
| 310 |
| 28,8 | 9,5 | 448 | 70,2 | 59,7 | 3,8 | 3,7 | 100 | 58 | 104 | 152 | 0,56 | 0,755 | |
| 311 |
| 26,6 | 8,9 | 413 | 74,7 | 56,6 | 4,7 | 4,3 | 102 | 58 | 98 | 151 | 0,59 | 0,765 | |
| 312 |
| 25,2 | 8,5 | 422 | 71,1 | 56,9 | 4,9 | 6,1 | 80 | 62 | 119 | 202 | 0,52 | 0,645 | |
| 313 |
| 30,3 | 10,1 | 407 | 73,4 | 56,9 | 5,2 | 5,2 | 99 | 57 | 110 | 168 | 0,52 | 0,775 | |
| 314 |
| 24,7 | 8,4 | 416 | 70,2 | 57,2 | 6,2 | 7,9 | 83 | 59 | 117 | 196 | 0,50 | 0,645 | |
| 315 |
| 27,4 | 9,1 | 392 | 71,9 | 57,9 | 6,2 | 7,4 | 95 | 57 | 111 | 215 | 0,59 | 0,685 | |
| 316 |
| 28,8 | 9,6 | 436 | 69,1 | 57,7 | 5,1 | 6,4 | 80 | 61 | 111 | 195 | 0,55 | 0,765 | |
| 317 |
| 28,2 | 8,7 | 393 | 73,5 | 58,3 | 5,5 | 6,2 | 83 | 63 | 102 | 181 | 0,62 | 0,835 | |
| 318 |
| 24,8 | 8,5 | 412 | 69,7 | 57,6 | 4,9 | 6,1 | 102 | 58 | 115 | 179 | 0,50 | 0,675 | |
| 319 |
| 27,3 | 8,3 | 392 | 73,1 | 57,3 | 5,4 | 8,1 | 84 | 62 | 105 | 195 | 0,59 | 0,645 | |
| 320 |
| 26,5 | 8,8 | 421 | 69,4 | 56,6 | 5,4 | 6,8 | 89 | 58 | 105 | 166 | 0,55 | 0,785 | |