


Wheat Analysis
| Parameters | Minimum | Maximum | Average | Standard Deviation | Variation Coefficient |
|---|---|---|---|---|---|
| Test Weight (kg/hl) | 78,35 | 79,60 | 79,14 | 0,60 | 0,75 |
| Total Damaged Kernels(%) | 0,00 | 0,50 | 0,19 | 0,22 | 118,88 |
| Foreign Material(%) | 0,22 | 0,28 | 0,26 | 0,03 | 10,88 |
| Shrunken and Broken Kernels(%) | 0,46 | 0,64 | 0,53 | 0,09 | 16,27 |
| Yellow Berry Kernels(%) | 26 | 70 | 42 | 20 | 48,89 |
| Wheat (Triticum aestivum) (%) | 0,20 | 1,62 | 0,66 | 0,65 | 99,39 |
| Protein (13,5% Moisture) (%) | 9,7 | 11,4 | 10,6 | 0,8 | 7,82 |
| Protein(dry basis)(%) | 11,2 | 13,2 | 12,3 | 1,0 | 7,82 |
| Weight of 1000 Kernels (gr.) | 40,30 | 49,10 | 44,28 | 4,26 | 9,63 |
| Ash (% dry basis(%) | 1,530 | 1,840 | 1,738 | 0,141 | 8,09 |
Semolin Analysis
| Semolin Analysis | Parameters | Minimum | Maximum | Average | Standard Deviation | Variation Coefficient |
|---|---|---|---|---|---|---|
Milling |
Falling Number (seg) | 404 | 509 | 461 | 44 | 9,57 |
| Color (B) | 17,1 | 19,9 | 18,5 | 1,2 | 6,23 | |
| Wet Gluten (%) | 20,8 | 27,1 | 24,4 | 3,2 | 13,31 | |
| Gluten Index | 77 | 90 | 82 | 6 | 7,78 | |
Farinogram |
Energy Level | 29,8 | 33,9 | 32,1 | 1,9 | 6,03 |
| Degree Softening (12 min.) | 13 | 33 | 25 | 9 | 35,89 |
Grade Distribution
Appendix Of Locality Composite Samples
| Sample Identification | Wheat Analysis | |||||||||||
|---|---|---|---|---|---|---|---|---|---|---|---|---|
| Sample Number | Locality, District or Department | Grade | Test Weight (Kg/hl) | Total Damaged Kernels (%) | Foreign Material (%) | Shrunken And Broken Kernels (%) | Vitreous Kernels (%) | Wheat (Triticum aestivum) (%) | Protein (MOISTURE 13,5 % H°) (%) | Protein (dry basis) (%) | Weight Of 1000 Kernels (g) | Ash (dry basis) % |
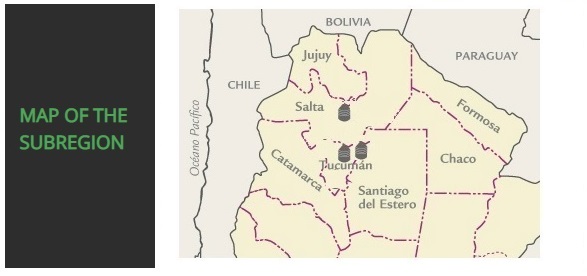
| 1 | Burruyacú | 1 | 79,60 | 0,08 | 0,28 | 0,46 | 70 | 1,62 | 11,2 | 12,9 | 41,10 | 1,530 |
| 2 | Cruz Alta | 1 | 79,60 | 0,16 | 0,28 | 0,46 | 42 | 0,44 | 11,4 | 13,2 | 49,10 | 1,840 |
| 3 | Leales | 4 | 79,00 | 0,50 | 0,26 | 0,54 | 26 | 0,36 | 10,1 | 11,7 | 40,30 | 1,800 |
| 4 | ANTA SANTA | 4 | 78,35 | 0,00 | 0,22 | 0,64 | 28 | 0,20 | 9,7 | 11,2 | 46,60 | 1,780 |
Appendix Of Locality Composite Samples
| Sample Identification | Semolin Analysis | ||||||
|---|---|---|---|---|---|---|---|
| Sample Number | Locality, District or Department | Milling | Farinogram | ||||
| Falling Number (sec.) | Color (B) | Wet Gluten (%) | Gluten Index | Farinogram Energy Level | Degree Softening (12 min.) | ||
| 1 | Burruyacú | 404 | 18,4 | 27,1 | 77 | 33,9 | 33 |
| 2 | Cruz Alta | 509 | 19,9 | 27,1 | 77 | 33,4 | 23 |
| 3 | Leales | 455 | 17,1 | 22,4 | 90 | 29,8 | 30 |
| 4 | ANTA SANTA | 477 | 18,7 | 20,8 | 85 | 31,1 | 13 |