


 WEATHER
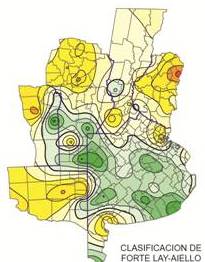
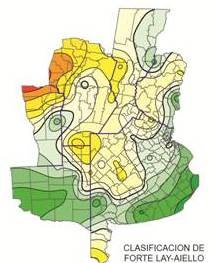
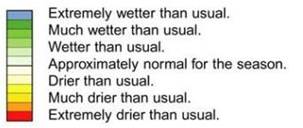
Weather behavior during the wheat campaign 2012-2013 is described using a method to calculate the water reservoirs in the soil and its anomalies. These latter are named ‘Classification of Soil Humidity’ and were calculated as a monthly average during all the entire wheat cycle, but come from a daily analysis, and express the degree of deviation from the habitual conditions for each region and period of year. Moisture classification is a proper indicator since it summarizes the behavior of the most relevant climatic variables, such as the spatial-temporal distributions of rains and their interaction with the evapotranspiration, which in turns depends on temperature, solar radiation, winds and atmospheric humidity.
The maps, which are used operationally and for any period of time, in this case are monthly and contain a politic subdivision by department, which may be associated to the main wheat areas of the country, representing here only Pampean provinces. The presentation of map sequence that classify the soil moisture and a description of its behavior allow the reader to have a clear idea of which was the weather evolution of wheat crop, and agronomic considerations are described in another section of this report. We should clarify that the habitual or normal conditions are not always the best suited for the crop in all regions and periods of the year; therefore, during the winter and early spring, normal conditions might be hydric deficit in regions located at the west and northwest of the wheat region, such as the V North sub-region, however these same conditions could represent situations of some soil water excess in the east center and south east of the wheat region.
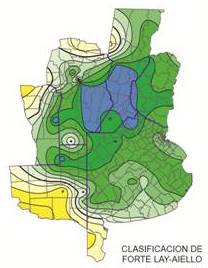
 MAY 2012
The beginning of wheat crop presented moisture conditions with a very proper distribution in the Province of Buenos Aires, with a normal situation in the center north of La Pampa and Cordoba provinces, and below normal values in Entre Ríos province.
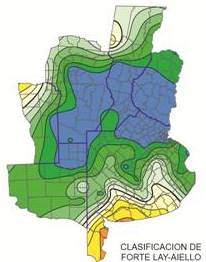
JUNE 2012
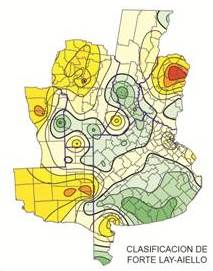
The most significant characteristic during this month was the identification of a dry pulse which resulted in drought conditions in the north of Entre Ríos province. In the rest of the region shown in the map, there were no major changes, and continued surface moisture conditions suitable for sowing, which allowed a normal crop timetable.
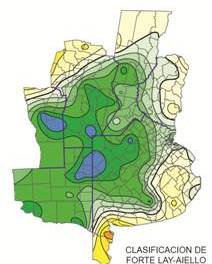
JULY 2012
July was characterized as the driest month of the season. To see this, we note that in the map there were no soil moisture conditions over the normal, with a dry pulse intensification in the north of Entre Ríos province. This situation of lack of rainfall and subsequent soil moisture losses had created a situation of concern among producers.
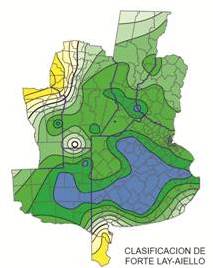
AUGUST 2012
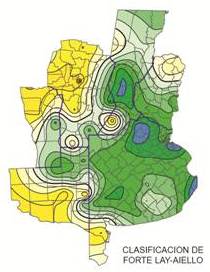
The recomposition of rain systems produced a radical change in the moisture distribution, filling the profiles in all the Pampean region and bringing great relief and benefit for the crops. It is important to note the disappearance of drought conditions in the north of Entre Ríos province and the appearance of hydric excesses in the north of Buenos Aires province. It is also interesting to observe the limited dry pulse at the South of Santa Fe province.
SEPTEMBER 2012
Good rain conditions continued and it is notable to observe that all the center of the Pampean region had soil moisture conditions with excesses, and the dominant feature was a scenario of profiles that benefited the development of the crops. Wheat nucleus area at the south east of Buenos Aires had nearly normal conditions, which resulted favorable for the development of the crops, which was a very similar situation to the 2011-2012 crop season.
OCTOBER 2012
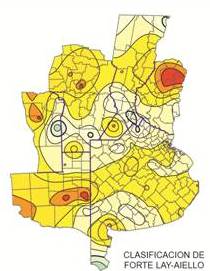
The situation during October was very interesting. By looking at the map, it can be noted that the reserves are in a ‘dipole’ situation, with excesses throughout at the center and dry conditions at the south of the province of Buenos Aires. There were conditions of higher atmospheric demand, and in those locations with no rains, moisture variations were rapidly detected.
NOVEMBER 2012
Very good conditions in almost all the Pampean region were registered, except for a strip comprising the eastern part of the region, where notwithstanding the conditions were normal. These conditions allowed a proper develop of wheat cycle stages, and therefore, a normal harvest was expected, which may be good in the south east of Buenos Aires, the last to harvest and which still holding to maintain good water reserves in the soil, reaching for the most demanding stages in that area.
DECEMBER 2012
As a month of harvest in the center and north of the region, positive anomalies of moisture in the soil are in general not favorable for wheat, and these conditions as outlined in the map, produced difficulties during harvest.
JANUARY 2013
The map of the average hydric situation of this month is added, since it is still a harvest period in the south east extreme of wheat region. Soil moisture, slightly above normal did not influence harvest operations.
| MAY 2012 | JUNE 2012 | JULY 2012 |
|
|
|
| AUGUST 2012 | SEPTEMBER 2012 | OCTOBER 2012 |
|
|
|
| NOVEMBER 2012 | DECEMBER 2012 | JANUARY 2013 |
|
|
|
| ||