


 CLIMA
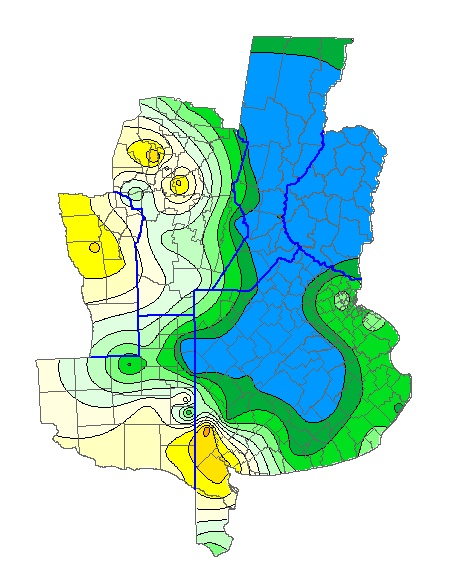
CLIMAWeather behavior during the 2018/19 wheat growing season is described by estimating soil moisture and its inadequacies. Inadequate soil moisture levels or, as we call them, « Soil Moisture Classification » was estimated as a monthly average along the wheat cycle. However, values derive from daily analysis and express deviations from normal conditions in every region and period. Moisture classification is a good indicator of weather conditions because it summarizes relevant variables including space and time distribution of rainfall, the interaction with evapotranspiration that, in turn, depends on ambient temperature, solar radiation, winds and air humidity.
These maps are based on monthly data. The political subdivision corresponds to provincial departments that can be associated with wheat growing areas; only the provinces located in the Pampas are represented here. The sequence of soil moisture maps and their description give readers a proper idea of the weather evolution along the wheat growing season. Agronomic considerations are described in another chapter. Common and ordinary conditions are not always the most adequate for crops in every region and time of year. Winter and early spring conditions may present water deficits in areas located to the west and the northeast, such as Region V North. However, the same conditions may feature water excess to the center east and southeast of the wheat growing area.
 MAY 2017
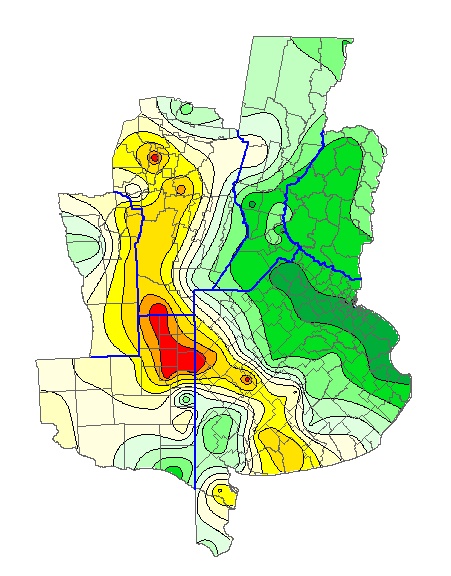
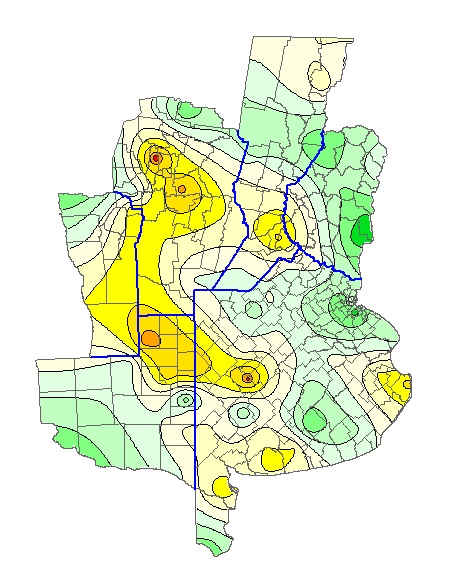
Soil moisture averages were low (dry soil) in the north of the province of La Pampa, while conditions were very good in the south of Santa Fe, Entre Rios and north of Buenos Aires. During the 2018/19 season, forecast models predicted El Niño weather conditions to be not as powerful as other years. The phenomenon was low or moderate in intensity.
JUNE 2017
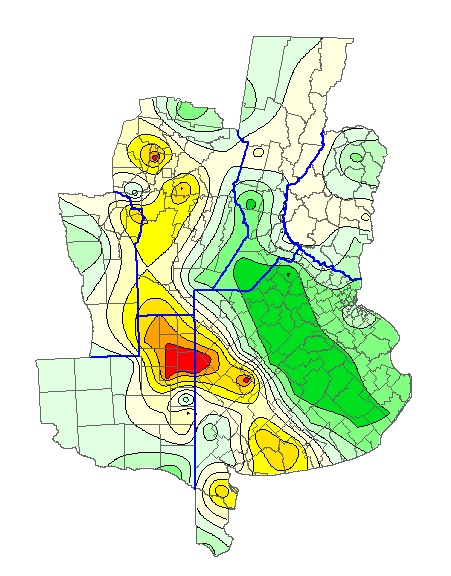
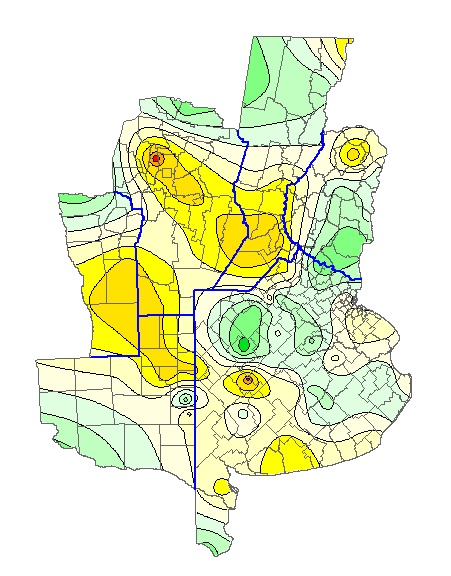
Dry weather continued in the north of the province of La Pampa and, though less intense, in the south of Buenos Aires. The west of the province of Buenos Aires presented soil moisture levels below average and the center-east enjoyed proper growing conditions.
JULY 2017
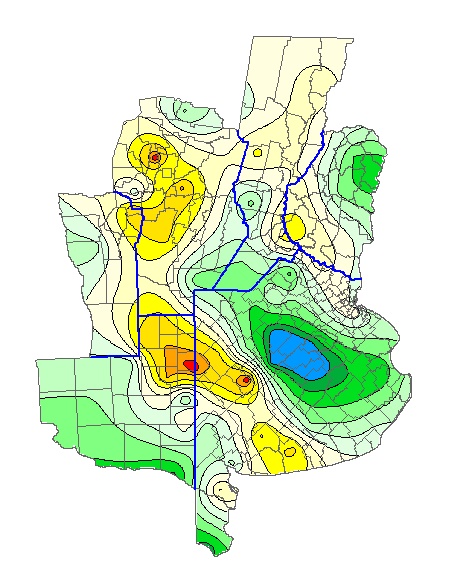
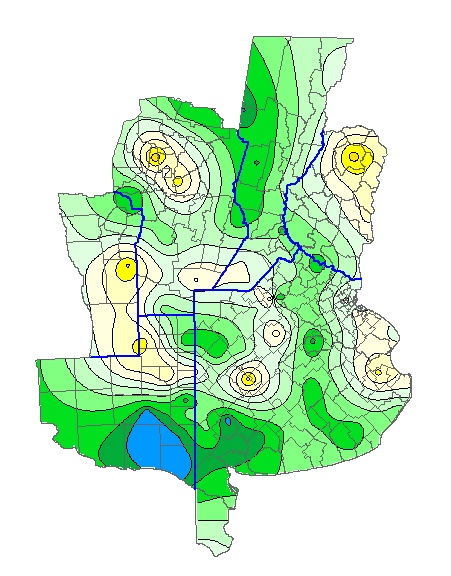
Water stress continued in the areas mentioned in the two previous
months. However, a region in the center of Buenos Aires already presented water
excess. The remaining pampas enjoyed regular or above mid moisture level; a
very important condition for the wheat season.
AUGUST 2017
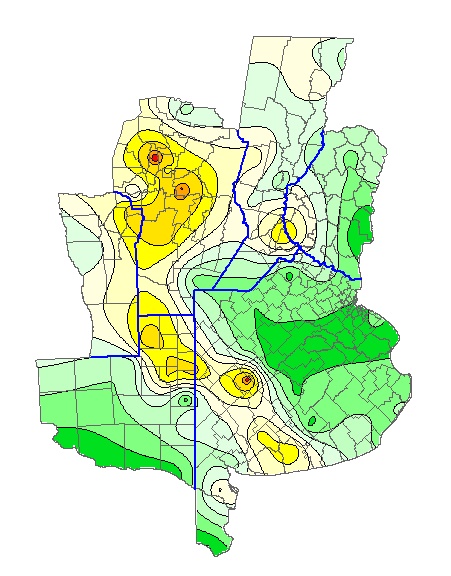
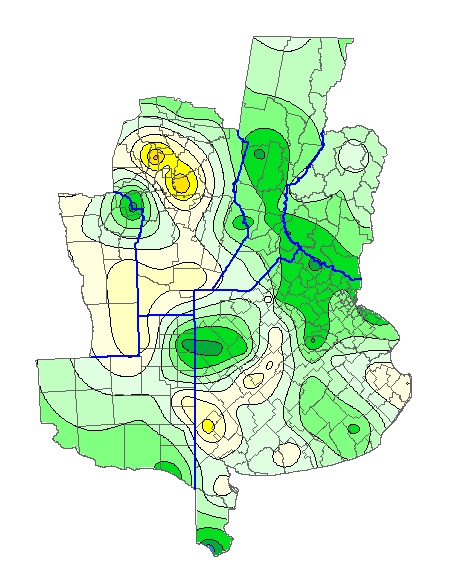
Same weather conditions continued in July. The El Niño settled for the remaining of the season, which favored the flow of air humidity, and good rains across large regions of Argentina.
SEPTEMBER 2017
This is a very important month for wheat: good rains kept soil moisture at proper levels, without excesses.
OCTOBER 2017
October was peculiar: the center west of Cordoba and Santa Fe had a fine water supply, that did not compromise wheat growth.
NOVEMBER 2017
November was key to confirm wheat yields across the Pampa Humeda (Wet Pampas). Rains kept excellent soil moisture levels. El Niño increased water volumes, due to its intensity.
DECEMBER 2017
Again, good conditions in the Pacific; with a moderate intensity El Niño and humidity coming from the South Atlantic, as well as good rains.
JANUARY 2018
Heavy rains led to water excess, as shown on the map. However, wheat production in the Region Pampeana was excellent.
| MAY 2018 | JUNE 2018 |
 |
 |
| JULY 2018 | AUGUST 2018 |
 |
 |
| SEPTEMBER 2018 | OCTOBER 2018 |
 |
 |
| NOVEMBER 2018 | DECEMBER 2018 |
 |
 |
| JANUARY 2019 | |
|
|