INTRODUCTION
TRIGO PAN
Triticum aestivum L.
Wheat crop was benefited from the good water refill of the soil profile, due to rains occurred during the late summer-autumn period in the main producing area of the country. The major contribution was given by the rains occurred during May and June. These conditions permitted the crop, between the stages of emergence up to the end of tillering, to have a proper availability of useful water in the soil profile, not being a limit to the yield expression.
| |||||||||||||||||||||||||||||||||||||||||||||||||||||||||||||||||||||||||||||||||||||||
In NOA region, in some areas, the wheat was displaced by other crops such as sugar cane and legumes like chickpeas.
In NEA region, the lack of rainfall during the period of grain number definition was the main factor affecting the yields, which an average between 30-35 % lower in than the previous campaign.
In the sub-region I the average yields by department ranged between 2,600 and 3,500 kg/ha, highlighting several lots with maximum productivities of 4,000 to 4,500 kg/ha.
In the sub-region II North, the yield was higher than the previous forecasts based on the status of the crops, with averages of 3,800 to 4,000 kg/ha, minimums of 2,500 kg/ha and maximums of 5,500 kg/ha.
In the sub-region II South, yields could not equal those of the campaign 2010/11, although they surpassed the historical average. Some fields ranged between 5,000 and 6,500 Kg/ha.
In sub-region III the outputs were moderate with an average of 3,483 kg/ha.
In sub-region IV sufficient humidity for sowing and water deficit alternated in some areas and the grain filling was very good. The outputs in general were good to very good, although they did not reach the high values of the previous campaign, varying between 3,000 and 6,000 kg/ha.
In the sub-region V North, the sown surface was 15 % inferior to that of the previous campaign, mainly due to the lack of proper humidity in the soil profile. The rainfed wheat yields were nearly 2,000 kg/ha, while those with irrigation varied between 3,000 and 4,500 kg/ha.
In the sub-region V South, due to the drought yields were very low, with areas that were not harvested due to frost damages, reaching, in some areas 2,300 kg/ha or more, as well as in areas as the low mountain range.
National production fell 11.2 % as regards the campaign of 2010/11, with an average yield of 2,960 kg/ha, lower than to the record of the previous campaign that was 3,398 kg/ha.
SAMPLING STRUCTURE
It was agreed to obtain samples which represent about 4,000 tons each, reaching a total of 156 analysis to be performed.
The sampling was planned proportionally to the territorial division (district or department) sown area, and the average yield registered the last three years, according to the ex Secretariat of Agriculture, Livestock, Fishery and Food data. In accordance with the estimated production resulting, the composite sample number to be obtained by each district or department was determined to achieve a proportional representativeness of each locality.
The Argentine Cooperatives Association, the Federation of Country Elevators Association, Argentine Federated Farmers SCL and the Argentine Federation of Milling Industry, through the cooperatives, country elevators and mills selected for each locality, submitted the primary operations samples (trade samples of farmer deliveries) which were starting points to make the locality composite samples, according to instructions given to those in charge of the sampling.
Likewise the Coordination of Offices in the interior of the country of MAGyP bring the support in the sampling.
| ||||||||||||||||||||||||||||||||||||||||||||||||||||||||||||
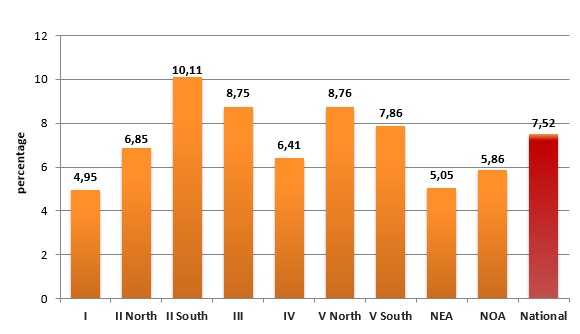
These primary samples had to represent between 100 and 250 ton, and be selected so they reflected the zone production conditions as well as possible, being 257 samples used for this sampling program, in such a way a sampled tonnage of 7,52% of the national wheat production, which amounted to 12.959.457 tons, was reached.
|