 SUBREGION NOA
BACKGROUND FOR THE CROP
The 2018/19 wheat season started in May. Moisture build-up ranged from right to regular in the different departments.
This year, water build-up was not good in the different soil profiles. Low temperatures delayed the growth cycle in reproductive stages. Tucuman witnessed soft frosts. Dryland wheat suffered the lack of humidity and was affected by high temperatures in September and October. The development of wheat under irrigation was better. By late October, rains delayed harvest; some grains presented shoots.
Dryland wheat yields in the province of Salta were low but better in areas under irrigation; 8 to 20 q/h and some plots were lost due to water excess. Weather conditions prevented harvest in 30% of the plots in Tucuman. Yields ranged from 400 to 1,200 kg/h. Plots harvested before the storm presented higher yields, even above 18 q/h.
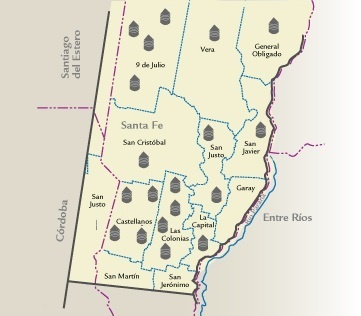
| | MAP OF THE SUBREGION |
 |
RESULTS OF THE ANALYSES
| |||||||||||||||||||||||||||||||||||||||||||||||||||||||||||||||||||||||
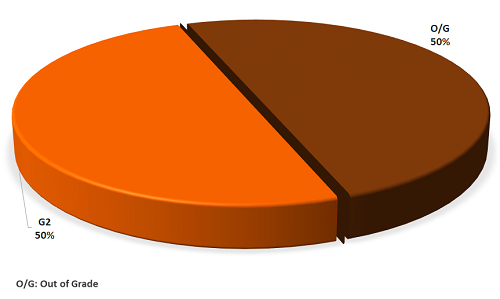
| | GRADE DISTRIBUTION |

|
| FLOUR ANALYSIS |
PARAMETERS | MINIMUM | MAXIMUM | AVERAGE | STANDARD DEVIATION | VARIATION COEFFICIENT | |||
| MILLING | Wet Gluten (%) | 22,6 | 28,2 | 25,5 | 2,3 | 9,11 | |||
| Dry Gluten (%) | 8,4 | 10,8 | 9,5 | 0,9 | 9,88 | ||||
| Falling Number (s) | 150 | 369 | 247 | 78 | 31,37 | ||||
| Flour Yield (%) | 68,40 | 70,00 | 69,27 | 0,51 | 0,73% | ||||
| Ash (dry basis) (%) | 0,650 | 0,736 | 0,698 | 0,033 | 4,70 | ||||
| FARINOGRAM | Water Absorption (14%H°)(%) | 58,0 | 65,7 | 61,7 | 3,0 | 4,89 | |||
| Development Time (min.) | 2,0 | 6,6 | 4,0 | 1,5 | 36,54 | ||||
| Stability (min.) | 2,0 | 15,5 | 7,8 | 4,4 | 56,74 | ||||
| Degree of Softening(12 min.) | 32 | 149 | 84 | 39 | 46,49 | ||||
| ALVEOGRAM | |||||||||
| P (mm) | 60 | 156 | 115 | 32 | 27,87 | ||||
| L (mm) | 37 | 97 | 60 | 19 | 32,28 | ||||
| W Joules x 10-4 | 181 | 287 | 247 | 33 | 13,37 | ||||
| P / L | 0,62 | 4,22 | 1,91 | 1,23 | 64,68 | ||||
| These results were elaborated with 6 composite samples prepared proportionally from 32 primary samples (farmer deliveries) | |||||||||
SUBREGION DATA
In this sub region the wheat production was 505.958 tons., the 2,6 % of the national total. Were sampled 24.000 tons., the 4,7% of the sub region production.
| APPENDIX OF LOCALITY COMPOSITE SAMPLES | |||||||||||||
| SAMPLE IDENTIFICATION | WHEAT ANALYSIS | ||||||||||||
| SAMPLE NUMBER | LOCALITY, DISTRICT OR DEPARTMENT | TONNAJE | GRADE | TEST WEIGT (Kg/hl) |
TOTAL DAMAGED KERNELS (%) | FOREIGN MATERIAL (%) |
SHRUNKEN AND BROKEN KERNELS (%) | YELLOW BERRY KERNELS (%) |
PROTEIN (MOISTURE 13,5 % H°) (%) |
PROTEIN (dry basis) (%) |
WEIGT OF 1000 KERNELS (g) |
ASH (dry basis) (%) | |
| 3 |
| 4000 | F/E (3) | 77,50 | 2,77 | 1,98 | 0,29 | 2,39 | 11,9 | 13,8 | 31,36 | 1,941 | |
| 4 | 4000 | F/E (3) | 77,10 | 0,48 | 2,17 | 0,46 | 1,65 | 10,6 | 12,3 | 33,05 | 1,941 | ||
| 5 | 4000 | 3 | 80,40 | 0,90 | 0,89 | 0,40 | 2,60 | 11,4 | 13,2 | 34,52 | 2,092 | ||
| 6 | 4000 | 2 | 80,50 | 0,93 | 0,64 | 0,65 | 3,06 | 11,7 | 13,5 | 33,85 | 1,699 | ||
| 7 | 4000 | F/E (3) | 78,20 | 11,14 | 0,50 | 0,79 | 1,79 | 12,7 | 14,6 | 32,37 | 1,814 | ||
| 8 | 4000 | F/E | 81,00 | 6,32 | 0,32 | 0,38 | 2,82 | 12 | 13,9 | 33,28 | 1,861 | ||
| APPENDIX OF LOCALITY COMPOSITE SAMPLES | |||||||||||||||
| SAMPLE IDENTIFICATION | FLOUR ANALYSIS | ||||||||||||||
| SAMPLE NUMBER | LOCALITY, DISTRICT OR DEPARTMENT | WET GLUTEN(%) | DRY GLUTEN(%) | FALLING NUMBER (sec.) | FLOUR YIELD(%) | FARINOGRAM | ALVEOGRAM | ASH(dry basis)(%) | |||||||
| % WA (14 % H°) | D. T. (min.) | STABILITY (min.) | DEGREE SOFTENING(12 min.) | P | L | W | P/L | ||||||||
| 3 | Salta | 24,4 | 9,0 | 260 | 68,90 | 65,7 | 4,0 | 6,3 | 79 | 151 | 42 | 270 | 3,60 | 0722 | |
| 4 | Salta | 22,9 | 8,5 | 369 | 69,50 | 58 | 4,9 | 15,5 | 32 | 108 | 57 | 244 | 1,89 | 0,650 | |
| 5 | Salta | 22,6 | 8,4 | 291 | 68,40 | 65,1 | 3,5 | 6,1 | 63 | 156 | 37 | 254 | 4,22 | 0,724 | |
| 6 | Salta | 26,7 | 9,9 | 263 | 70,00 | 60,7 | 6,6 | 11,5 | 61 | 112 | 66 | 287 | 1,70 | 0,660 | |
| 7 | Tucumán | 28,2 | 10,5 | 150 | 69,50 | 62,6 | 2 | 2,0 | 149 | 104 | 63 | 246 | 1,65 | 0,696 | |
| 8 | Tucumán | 28,2 | 10,8 | 150 | 69,30 | 58,3 | 3 | 5,4 | 118 | 60 | 97 | 181 | 0,62 | 0,736 | |


