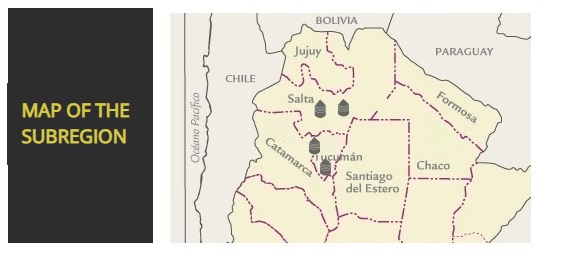

In Jujuy, soweing covered approximately 4500 h, beginning in May on soybeans and later on bean stubble. The season started with low moisture in the soil profile due to the lack of rains from late summer to early autumn. Average yields were 900 Kg/h under rainfed and 3500 kg/h in irrigated fields, where more technology and fertilization were applied. Harvest started by mid October. As to grain quality, protein content was lower compared to previous seasons: 10 to 11%


Wheat Analysis
| Parameters | Minimum | Maximum | Average | Standard Deviation | Variation Coefficient |
|---|---|---|---|---|---|
| Test Weight (kg/hl) | 78,70 | 80,90 | 79,93 | 0,75 | 0,93 |
| Total Damaged Kernels(%) | 0,08 | 0,26 | 0,14 | 0,06 | 46,73 |
| Foreign Material(%) | 0,38 | 1,16 | 0,93 | 0,33 | 35,88 |
| Shrunken and Broken Kernels(%) | 0,34 | 0,70 | 0,49 | 0,14 | 28,24 |
| Yellow Berry Kernels(%) | 1,97 | 3,57 | 2,16 | 0,45 | 20,66 |
| Protein (13,5% Moisture)(%) | 10,3 | 12,3 | 11,4 | 0,7 | 6,16 |
| Protein(dry basis)(%) | 12,0 | 14,2 | 13,2 | 0,8 | 6,16 |
| Weight of 1000 Kernels(g) | 30,26 | 34,23 | 33,12 | 1,58 | 4,78 |
| Ash (% dry basis(%) | 1,663 | 1,942 | 1,766 | 0,102 | 5,77 |
Grade Distribution
Flour Analysis
| Parameters | Parameters | Minimum | Maximum | Average | Standard Deviation | Variation Coefficient |
|---|---|---|---|---|---|---|
Milling |
Gluten Húmedo (%) | 20,6 | 29,5 | 25,7 | 3,0 | 11,79 |
| Gluten Seco (%) | 7,6 | 10,9 | 9,5 | 1,1 | 11,76 | |
| Falling Number (seg) | 389 | 446 | 419 | 25 | 5,85 | |
| Rto. Harina (%) | 68,6 | 70,4 | 70,0 | 0,7 | 0,96 | |
| Cenizas (s.s.s)(%) | 0,735 | 0,816 | 0,759 | 0,023 | 3,06 | |
Farinogram |
Absorción de Agua (14 % H)(%) | 58,3 | 66,5 | 64,9 | 2,2 | 3,35 |
| Tiempo de Desarrollo (min) | 6,2 | 17,3 | 14,0 | 3,1 | 22,45 | |
| Estabilidad (min) | 19,2 | 41,0 | 26,6 | 6,6 | 24,81 | |
| Aflojamiento (12 min) | 1 | 29 | 17 | 10 | 57,96 | |
Alveogram |
P (mm) | 134 | 180 | 157 | 13 | 8,02 |
| L (mm) | 26 | 54 | 43 | 10 | 23,77 | |
| W joules X 10 4 | 242 | 343 | 284 | 45 | 15,68 | |
| P / L | 2,89 | 6,92 | 3,98 | 1,45 | 36,53 |
Appendix Of Locality Composite Samples
| Sample Identification | Wheats Analysis | |||||||||||
|---|---|---|---|---|---|---|---|---|---|---|---|---|
| Sample Number | Locality, District or Department | Tonnaje | Grade | Test Weight (Kg/hl) | Total Damaged Kernels (%) | Foreign Material (%) | Shrunken And Broken Kernels (%) | Yellow Berry Kernels (%) | Protein (MOISTURE 13,5 % H°) (%) | Protein (dry basis) (%) | Weight Of 1000 Kernels (g) | Ash (dry basis) (%) |
| 1 | Salta | 4000 | 3 | 80,60 | 0,14 | 1,16 | 0,34 | 2,06 | 12,3 | 14,2 | 34,23 | 1,663 |
| 2 | Salta | 2000 | 2 | 78,70 | 0,26 | 0,38 | 0,70 | 2,05 | 11,4 | 13,1 | 30,26 | 1,942 |
| 3 | Tucumán | 1000 | 2 | 80,90 | 0,10 | 0,40 | 0,68 | 3,57 | 10,3 | 12,0 | 31,19 | 1,863 |
| 4 | Tucumán | 4000 | 3 | 79,63 | 0,08 | 1,11 | 0,50 | 1,97 | 10,9 | 12,6 | 33,91 | 1,757 |
Appendix Of Locality Composite Samples
| Sample Identification | Flour Analysis | |||||||||||||
|---|---|---|---|---|---|---|---|---|---|---|---|---|---|---|
| Sample Number | Locality, District or Department | Milling | Farinogram | Alveogram | ||||||||||
| Wet Gluten (%) | Dry Gluten (%) | Falling Number (SEC.) | Flour Yield (%) | Ash (dry basis) (%) | % WA (14 % H°) | D. T. (min.) | Stability (min.) | Degree Softening (12 min.) | P (mm) | L (mm) | W joules x 10 | P / L | ||
| 1 | Salta | 29,5 | 10,9 | 446 | 70,3 | 0,735 | 65,8 | 17,3 | 19,2 | 29 | 156 | 54 | 343 | 2,89 |
| 2 | Salta | 23,7 | 8,8 | 421 | 68,6 | 0,761 | 66,5 | 13,2 | 31,2 | 7 | 180 | 26 | 242 | 6,92 |
| 3 | Tucumán | 20,6 | 7,6 | 428 | 69,7 | 0,816 | 58,3 | 6,2 | 41,0 | 1 | 134 | 46 | 260 | 2,91 |
| 4 | Tucumán | 24,2 | 9,0 | 389 | 70,4 | 0,769 | 64,9 | 13,1 | 28,1 | 14 | 151 | 39 | 253 | 3,87 |


